ToxGenie
The Automated Statistical Solution for Toxicologists.
ToxGenie automates complex statistical decisions. Get OECD, EPA, and GLP-compliant reports 70% faster.
30-Day Free Trial • No Credit Card Required • Windows OS Only
General statistical tools weren't built for toxicology.
They are built for statisticians. The result? Wasted hours, compliance risks, and endless frustration.
Drowning in Data, Starving for Context.
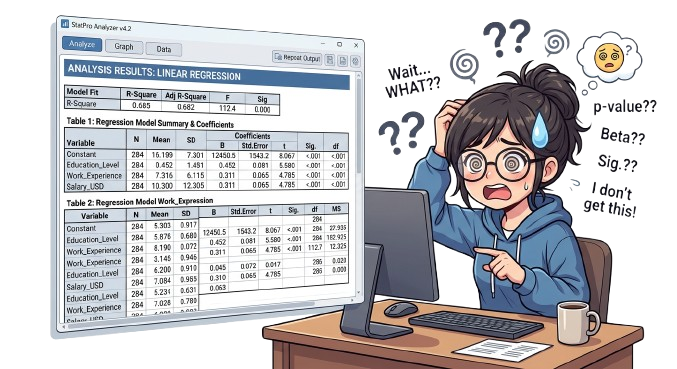
Staring at a wall of p-values and confidence intervals. General tools give you raw numbers, leaving you to spend hours figuring out what they actually mean for your toxicity study.
The "Which Test Do I Use?" Anxiety.
Parametric or non-parametric? Dunnett’s or Dunn’s? Choosing the wrong statistical model isn’t just frustrating—it leads to inconsistent results and regulatory rejection.

The "Black Box" Trap.
You get a result, but can’t explain the logic behind it. When GLP auditors or peer reviewers ask “Why this method?”, you need a transparent answer, not guesswork.
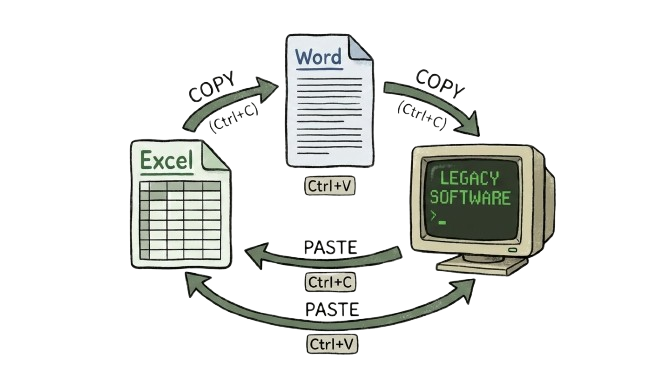
Endless Copy-Paste Fatigue.
Moving data from Excel to a stat tool, then manually copy-pasting tables into Word for GLP reports. It’s mind-numbing manual labor that introduces fatal human errors.
Meet ToxGenie. The automation you’ve been waiting for.
The first toxicology-dedicated software that integrates Endpoint Analysis and
Advanced Statistics in one intuitive platform.
Get ECx, LCx, LDx, ICx and 95% CI in Minutes, Not Hours.
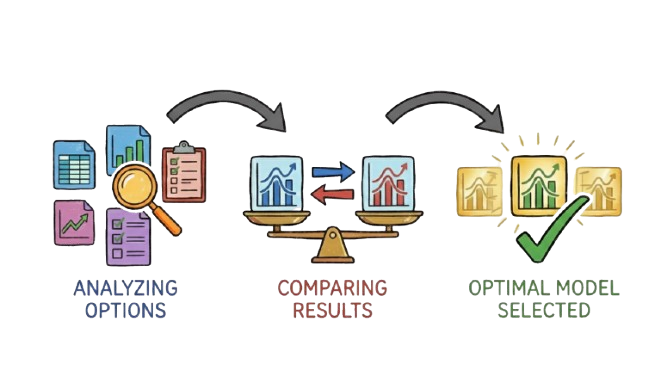
Stop guessing which model to use.
ToxGenie intelligently evaluates your input data (Quantal, Count, or Quantitative) and automatically applies the optimal point estimation method. 100% GLP and OECD compliant.
Point Estimation
Graphical Method
Applied when no partial mortalities exist and group reaches 100% mortality.
Moving Average-Angle Method
Applied when no partial mortalities exist but at least two group reaches 100% mortality.
Spearman-Karber Method
Requires a monotonically increasing response with exactly one partial mortality group.
Trimmed Spearman-Karber Method
Applied when the dose-response pattern is not monotonically increasing.
Logit Method
Applied when only 2–3 partial mortality groups are present.
Probit Method: Maximum Likelihood
Requires a minimum of 4 partial mortality groups with goodness-of-fit assessed by chi-square (χ²) test.
Linear and Non-Linear Regression Method
Applied exclusively to quantitative/continuous data, not binary mortality outcomes.
“Check the reliability of ToxGenie’s analysis results”
How does ToxGenie automatically select the point estimation method for EC50 or LC50?
ToxGenie evaluates three properties of your input data: data type (quantal, count, or quantitative), the number and pattern of partial effects, and whether the dose-response relationship is monotonic. Based on these properties, it automatically applies the most appropriate method — Spearman-Kärber, Probit (Maximum Likelihood), Logit, or Non-Linear Regression — without any manual selection.
What is the difference between EC50, LC50, IC50 and when should each be used?
EC50 (Effect Concentration 50%) is the concentration that causes a 50% effect in a biological system, typically used in sub-lethal toxicity tests such as algae growth inhibition or Daphnia immobilization. LC50 (Lethal Concentration 50%) is the concentration that kills 50% of test organisms, used in acute lethality studies with fish or invertebrates. IC50 (Inhibition Concentration 50%) refers to 50% inhibition of a specific biological process. ToxGenie calculates all three, along with 95% confidence intervals, automatically.
Does ToxGenie calculate 95% confidence intervals for EC50 and LC50?
Yes. ToxGenie automatically calculates 95% confidence intervals for all point estimates including EC10, EC20, EC50, LC50, and LD50. The confidence interval method is selected based on the estimation method used — for example, Abbott’s correction for Spearman-Kärber, or profile likelihood for Probit Maximum Likelihood. This output is required by OECD and EPA toxicity test guidelines.
Automated Hypothesis Testing for NOEC & LOEC.
ToxGenie doesn’t just give you a number.
It automatically runs normality and homogeneity assessments, selects the correct parametric or non-parametric test, and provides a 100% transparent, statistically defensible decision path.
Hypothesis Test
Outlier Detection
Performed to detect and handle extreme values that may distort statistical analysis.
Normality & Homogeneity Assessment
Evaluates whether data follows normal distribution and has equal variance across groups.
Automatic Data Transformation
Applied when data is non-normal or heterogeneous to meet parametric test assumptions.
A priori Comparisons
Pre-planned comparisons between control and treatment groups before statistical testing.
Parametric Test
Used when data is normally distributed with homogeneous variance (e.g. Dunnett’s test, t-test).
Non-Parametric Test
Applied for non-normal or heterogeneous data (e.g. Steel’s test, Wilcoxon rank sum test).
“Check the reliability of ToxGenie’s analysis results”
What statistical test is used for NOEC and LOEC determination in toxicity studies?
The correct test depends on your data properties. ToxGenie automatically determines which test to apply: for normally distributed data with equal replicates, Dunnett’s Test is used; for unequal replicates, T-Test with Bonferroni Adjustment; for non-normally distributed data with equal replicates, Steel’s Many-One Rank Test; for non-normal data with unequal replicates, Wilcoxon Rank Sum Test with Bonferroni Adjustment. All decisions are documented automatically in the analysis report.
What is the difference between NOEC and LOEC in toxicology?
NOEC (No Observed Effect Concentration) is the highest tested concentration at which no statistically significant effect is observed compared to the control group. LOEC (Lowest Observed Effect Concentration) is the lowest tested concentration at which a statistically significant effect is first detected. Together, NOEC and LOEC define the threshold range of a substance’s toxic effect and are required endpoints in most OECD chronic toxicity test guidelines.
Why does ToxGenie check normality before selecting a hypothesis test?
Parametric tests such as Dunnett’s Test assume that data follow a normal distribution. If this assumption is violated, the test results may be unreliable and lead to incorrect NOEC or LOEC values. ToxGenie automatically applies a normality test (Shapiro-Wilk) and a homogeneity of variance test (Levene’s Test) before selecting the appropriate statistical method, ensuring the analysis is valid and meets OECD and GLP requirements.
Beyond Endpoints: Advanced Statistics Built Strictly for Toxicology.
Stop navigating bloated, general-purpose software.
ToxGenie focuses only on the specific requirements of OECD and US EPA test guidelines. Input your data, and the software instantly applies the correct statistical test.
Statistical Analysis
Frequency Analysis
Evaluate the occurrence and distribution of quantal response data with Chi-Square or Fisher’s Exact Tests.
Trend Analysis
Identify dose-related trends using powerful tools like Cochran-Armitage (CA) Test, Jonckheere-Terpstra (JT) Test, and Linear Contrast F-Test to determine the direction of toxic effects.
Two-Group Comparison
Directly compare control vs. treatment groups using Student’s t-test (parametric) or Mann-Whitney U test (non-parametric) based on normality.
Multi-Group Comparison
Execute comprehensive comparisons across multiple dose levels with ANOVA or Kruskal-Wallis, followed by automated post-hoc tests (Dunnett’s, Bonferroni, etc.).
“Check the reliability of ToxGenie’s analysis results”
What statistical tests does ToxGenie use for toxicity data analysis?
ToxGenie covers four major analysis categories used in OECD toxicity test guidelines: Frequency Analysis (Chi-Square Test, Fisher’s Exact Test), Trend Analysis (Cochran-Armitage Test), Two-Group Comparison (t-Test, Mann-Whitney U Test), and Multi-Group Comparison (Dunnett’s Test, Steel’s Many-One Rank Test, Wilcoxon Rank Sum with Bonferroni Adjustment). The correct test is selected automatically based on the properties of your input data.
Why is Chi-Square Test used in some toxicity studies but not others?
The Chi-Square Test is used for quantal (categorical) toxicity data when the expected frequency in each cell of the 2×2 contingency table is 5 or greater. When expected frequencies are below 5 — which commonly occurs with small sample sizes or rare events in toxicity studies — Fisher’s Exact Test is used instead. ToxGenie automatically checks expected frequencies and selects the appropriate test, eliminating a common source of error when using general statistical software.
How is ToxGenie different from general statistical software for toxicity data analysis?
General statistical software requires users to manually select the correct statistical test, which is a common source of error in toxicity studies. ToxGenie is built specifically around OECD toxicity test guideline requirements and automatically applies the correct test based on the data type and study design. It also outputs NOEC, LOEC, and ECx endpoints directly, which general tools do not support without custom scripting.
ToxGenie-Exclusive Feature
OECD TG 201 Automated: The Algae Test Workflow, Perfected.
Stop processing biomass data manually.
ToxGenie delivers a complete, regulation-ready analysis for freshwater algae and cyanobacteria from raw data to ECx, NOEC, and validation criteria in a single click.
Limit & Definitive Test Validation
Automatically calculates test validity for both Limit and Definitive scenarios to ensure strict compliance with OECD TG 201 acceptance criteria.
OECD TG 201 ·Validity Criteria Auto-Checked
EC10, EC20, EC50 + 95% CI
Seamlessly estimates effect concentrations for both Average Growth Rate and Yield using optimized Non-Linear Regression models.
Non-Linear Regression · Auto model selection
Automated NOEC & LOEC
Evaluates normality and homogeneity in the background, instantly applying the correct parametric or non-parametric test to determine NOEC/LOEC.
Dunnett · Steel's Many-One
Limit Test Confirmation
Instantly confirms whether significant growth inhibition exists at the limit concentration for both Growth Rate and Yield via Two-Group Comparison.
Two-Group Comparison Auto-Selected
What software is used for OECD TG 201 algae growth inhibition analysis?
ToxGenie is the only dedicated toxicology software that fully automates OECD TG 201 analysis — including EC10, EC20, EC50 with 95% CI, NOEC, LOEC, and growth curve plotting — for both Average Growth Rate (μ) and Yield (Y) in a single workflow, without coding or manual test selection.
How is EC50 calculated for algae toxicity tests?
ToxGenie applies Non-Linear Regression to the dose-response data from your algae growth inhibition study, fitting the most appropriate model to estimate EC50 (and EC10, EC20) along with their 95% confidence limits — for both growth rate and yield endpoints simultaneously, per OECD TG 201 requirements.
What statistical test is used for NOEC and LOEC in algae toxicity?
ToxGenie automatically selects the correct test: for equal replicates with normal data, Dunnett’s Test is applied; for unequal replicates, T-Test with Bonferroni Adjustment; for non-normal data, Steel’s Many-One Rank Test or Wilcoxon Rank Sum Test with Bonferroni Adjustment. The decision is fully automated based on your dataset’s properties.
“Check the reliability of ToxGenie’s analysis results”
ToxGenie-Exclusive Feature
Stop Guessing Your Study Design. Predict Definitive Test Concentrations Instantly.
ToxGenie is the only toxicology software that automatically translates your preliminary (range-finding) data into an optimal, OECD-compliant geometric concentration series.
Perfect for both acute and chronic studies. No manual calculations.
Acute Toxicity Concentration Prediction
Input your range-finding data. ToxGenie analyzes the response pattern and generates a geometric series perfectly spaced to capture the full dose-response curve (0% to 100% effect), ensuring precise calculation of LC50, EC50, and LD50.
Auto Concentration Series (Acute)
Chronic Toxicity Concentration Prediction
Chronic tests require different sensitivity. ToxGenie evaluates your preliminary data and predicts a tighter concentration series strictly optimized for detecting low-dose chronic endpoints like NOEC, LOEC.
Auto Concentration Series (Chronicute)
How do I determine the concentrations for a definitive toxicity test?
In ToxGenie, you enter your range-finding (preliminary) test data — concentrations and observed effects — and select either acute or chronic test type. ToxGenie automatically analyzes the dose-response pattern and predicts an optimal geometric series of concentrations for your definitive test, designed to capture the full effect range from 0% to 100%, as required by OECD toxicity test guidelines.
Is there software that predicts definitive test concentrations from preliminary toxicity data?
ToxGenie is the only dedicated toxicology software that automatically predicts definitive test concentrations from range-finding data. General statistical tools such as GraphPad Prism, SPSS, SAS or Excel do not include this feature. ToxGenie supports both acute and chronic toxicity test types and outputs an OECD-aligned geometric concentration series, making it especially useful for graduate students and researchers new to toxicity testing.
What is a geometric concentration series in toxicity testing?
A geometric concentration series is a set of test concentrations where each value is multiplied by a constant factor (e.g., 10 or 2…). This spacing ensures even coverage across log-scale dose-response curves and is the standard format recommended by OECD and EPA toxicity test guidelines. ToxGenie automatically calculates the appropriate spacing factor and series based on your range-finding data.
“Check the reliability of ToxGenie’s analysis results”
Built for Toxicology. Not Just General Statistics.
General tools like Excel, GraphPad, SPSS, and R were built for broad use, meaning they are not optimized for the exact needs of your toxicology lab. They require manual test selection, lack endpoints specific to OECD guidelines, and demand hours of manual formatting. ToxGenie is the only platform built entirely for toxicologists and GLP CROs to deliver fully compliant results without requiring a single line of code.
70%+ Faster Analysis
From raw data to a GLP-ready report in one click, compared to manual workflows.
ZERO Coding Required
No stats degree or coding knowledge is required. Just upload and click.
10+ Toxicology Automations
OECD validity checks and model selections not found in any general software.
With general statistics software
Manual Decision Trees
decide analysis procedures and methods yourself
Scattered Tools (Excel+Stats+Word)
switch between analysis software, Excel, and Word to prepare results
No NOEC · LOEC output
requires custom scripting or manual calculation
Numbers only
no interpretation of what results mean for your study
With general statistics software
Automated OECD Compliance
decide analysis procedures and methods yourself
All-in-One Workflow
switch between analysis software, Excel, and Word to prepare results
Instant NOEC, LOEC & ECx etc.
No requires custom scripting or manual calculation
Plain-English Interpretations
Every result explained in the report automatically
How much time does ToxGenie save compared to manual toxicity data analysis?
ToxGenie reduces analysis time by approximately above 70% compared to manual workflows using general statistical software. Algae Growth Inhibition Test analysis that typically takes 3-4 hours using separate statistics, graphing, and word processing tools is completed in under 30 minutes hours with ToxGenie. This includes endpoint calculation (NOEC, LOEC, ECx), statistical test selection, report generation in PDF and MS Word format, and plain-language interpretation of all results.
Is ToxGenie suitable for graduate students with no statistical background?
Yes. ToxGenie requires no statistical expertise or coding knowledge. It automatically selects the correct test from your data, explains every decision in plain language, and provides written interpretation of all results. Graduate students can complete their first toxicity data analysis correctly without needing to understand the underlying statistical theory.
Can Excel be used for toxicity data statistical analysis?
Excel can perform basic calculations but is not suitable for professional toxicity data analysis. It does not support automatic statistical test selection, has no built-in NOEC, LOEC, or ECx calculation functions, and produces no structured regulatory reports. Using Excel for GLP studies requires extensive manual configuration and introduces a high risk of errors in test selection and data handling. ToxGenie automates all of these steps and produces audit-ready outputs aligned with OECD Test Guidelines.
ToxGenie-Exclusive Feature
Reports That Explain Why and What It Means
Numbers alone aren’t enough for regulatory submissions.
ToxGenie is the only software that automatically generates GLP-ready reports in PDF and MS Word, complete with plain-English interpretations and bulletproof statistical rationales. Ready for journals, ready for auditors.
Data Translated into Insights
Every output includes a written interpretation in plain English. Instantly understand what the numbers mean, whether the effect is significant. no statistical degree required.
Plain-Language Interpretation
Bulletproof Statistical Rationale
Never struggle to justify your methods to reviewers again. ToxGenie explicitly documents exactly why a specific test (e.g., Dunnett’s) was chosen, detailing normality and homogeneity results step-by-step.
Audit-Ready Defense
Workflow-Ready Formats (Word & PDF)
The editable .docx report lets you copy tables, results, and interpretation text directly into your GLP Final Report or journal manuscript. No tedious reformatting. No copy-paste errors between tools.
Ready for GLP & Journals
Does ToxGenie explain why a specific statistical test was selected?
Yes. Every ToxGenie report documents the complete statistical decision process including normality test results (Shapiro-Wilk), homogeneity of variance assessment (Levene’s Test), and replicate structure. Each report explains in plain language why each test was automatically selected, making your analysis fully auditable for GLP studies and defensible in peer review.
Does the report include interpretation of results, not just numbers?
Yes. Unlike general statistical software that outputs only p-values and tables, every ToxGenie report includes a plain-English interpretation of each result: what the NOEC or EC50 value means, whether the effect is statistically significant, and how to understand the finding in the context of your toxicity study. This is especially valuable for graduate students and researchers new to toxicity testing.
What format does ToxGenie use for statistical analysis reports?
ToxGenie generates statistical analysis reports in both PDF and MS Word (.docx) format. The PDF format is ideal for regulatory submission and archiving. The MS Word format allows you to copy and paste tables, results, and interpretation text directly into your GLP Final Report or journal manuscript without any reformatting.
Ready to automate your toxicology analysis?
Join the researchers and GLP contract research organizations saving hours on every study.