
Zero Manuals. Zero Learning Curve.
ToxGenie Features gives you a clear 3-step workflow from toxicity data to GLP-ready reports.
30-Day Free Trial • No Credit Card Required • Windows OS Only
Why Zero Manuals, Zero Learning Curve?
Because your time should be spent on research, not on software menus or statistics textbooks.
Learning Curve
- Traditional tools: Weeks or months to master coding or generic menus.
- ToxGenie: Start in a 3-step workflow. No manual required.
Statistical Error Risk
- Traditional tools: Manual test selection and formula errors.
- ToxGenie: Built-in logic applies the correct method for each data type.
Every Toxicity Data Analysis in 3 Simple Steps.
ToxGenie Features follows the same 3 simple steps for every analysis.
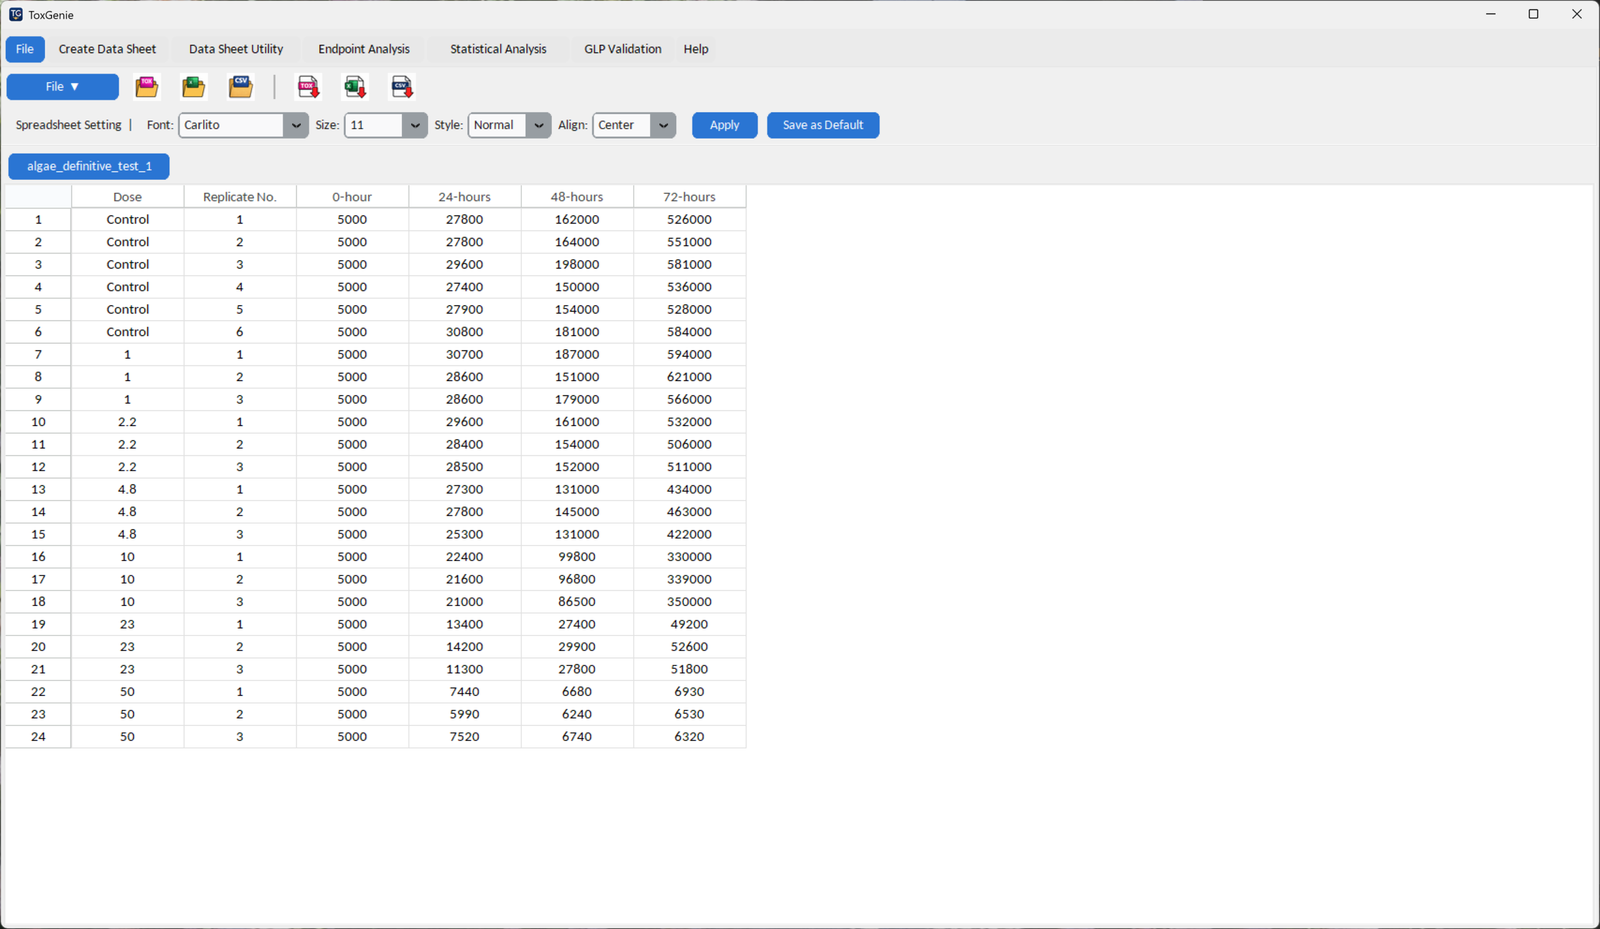
Enter Your Test Data
Create Data Sheet in ToxGenie, or edit a file in the sample data folder in Excel and Open it from the File menu.
- Quantal: e.g., 3 of 7 fish died
- Count: e.g., malformations or colonies
- Quantitative: e.g., body weight, growth, or clinical chemistry
- Ordinal: e.g., histopathology severity, clinical signs, FOB scores
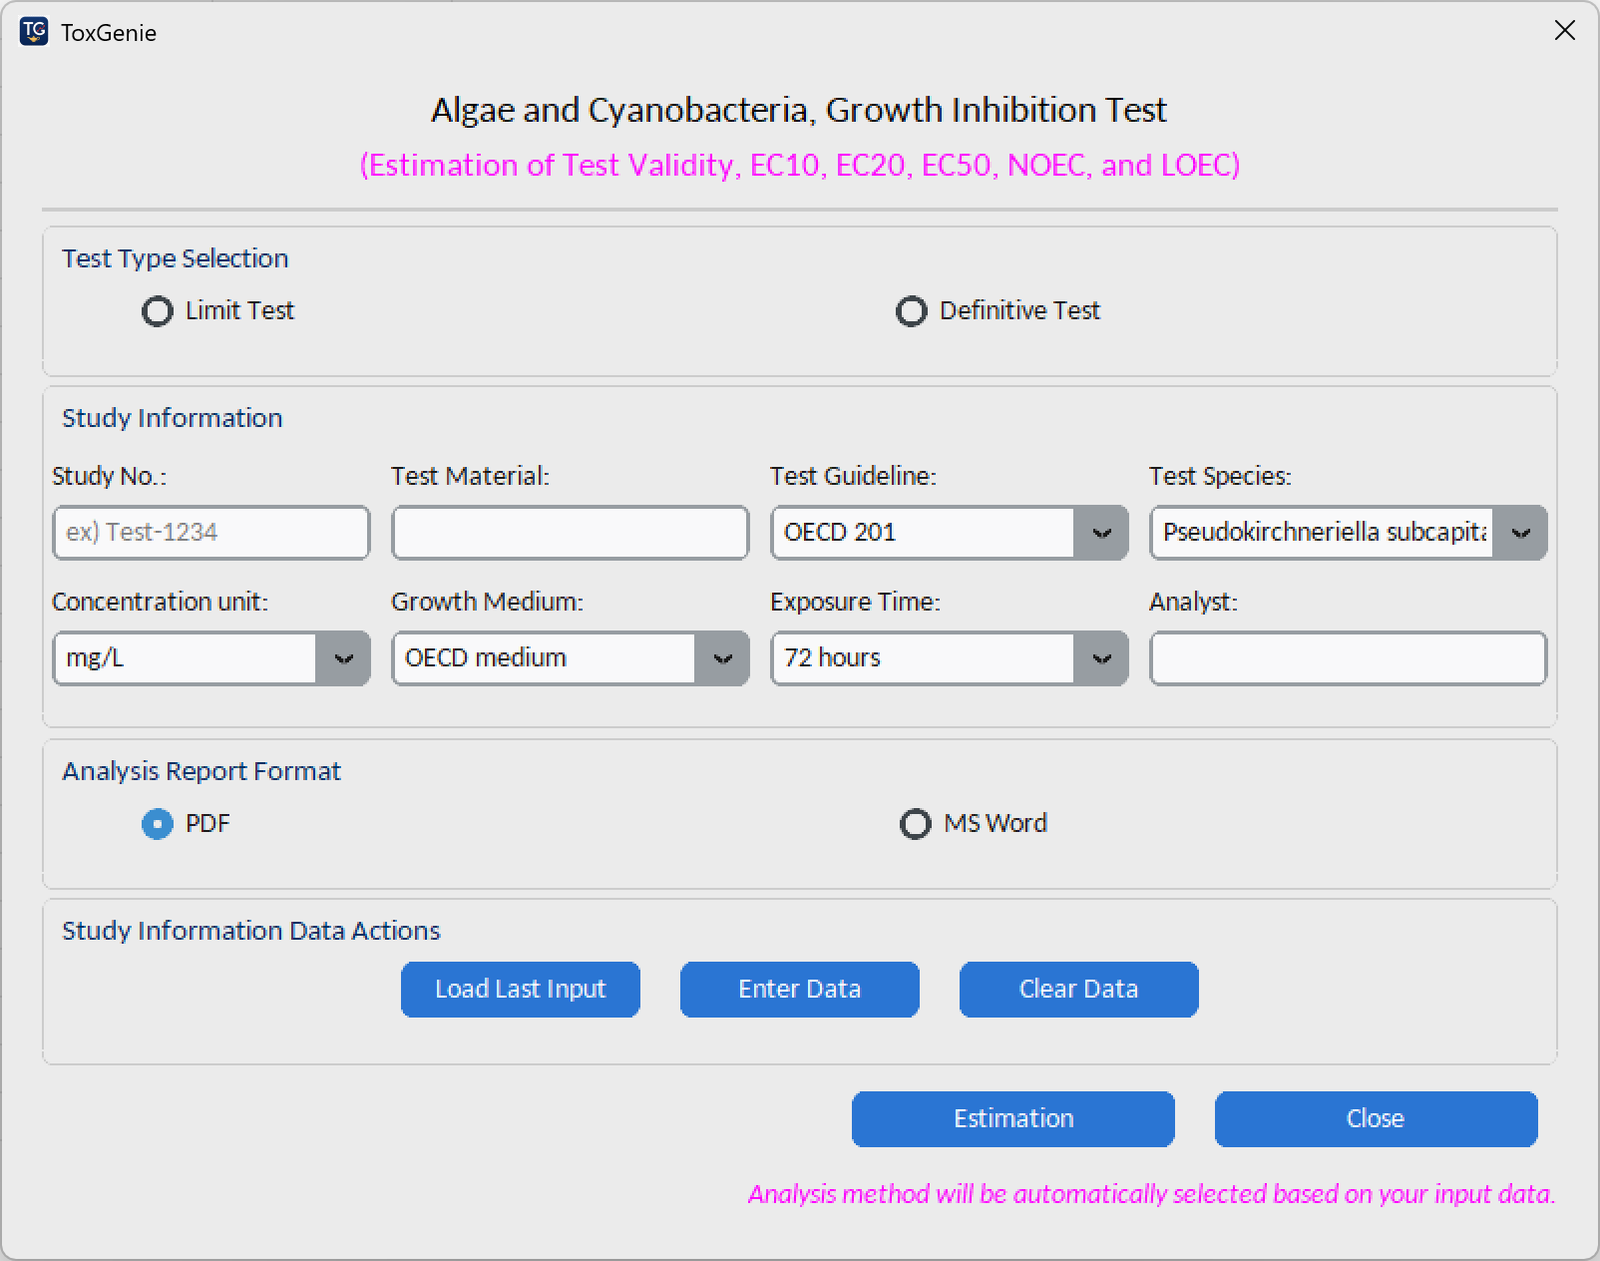
Select Analysis and Run
Open the Endpoint or Statistical Analysis tab.
- Select an analysis method.
- Enter the test information.
- Click estimation button.
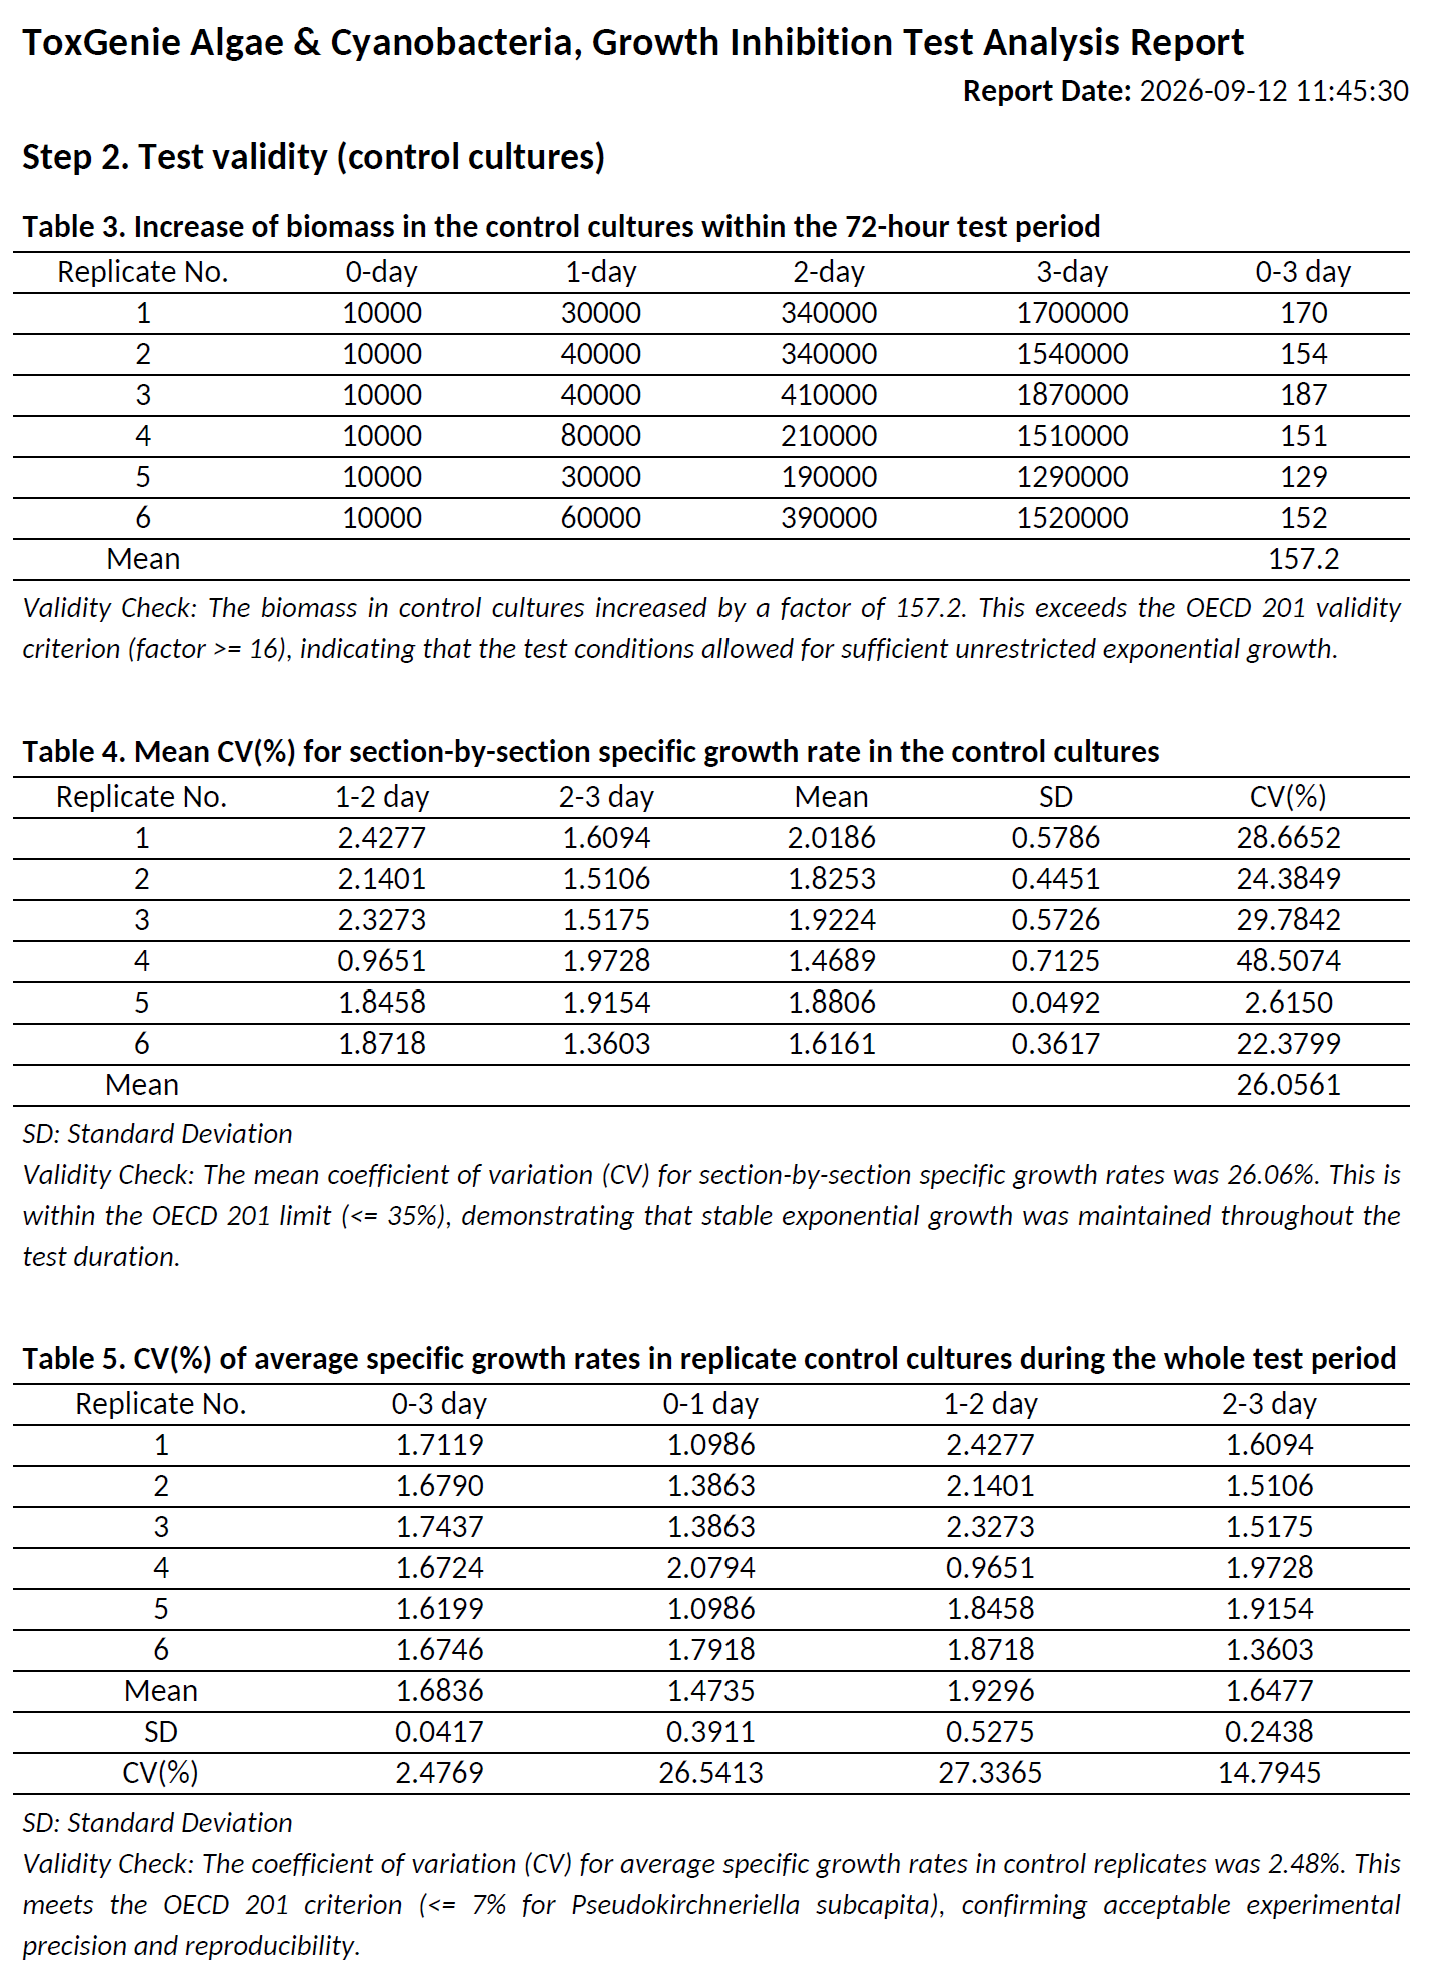
Get the Report
Download PDF for archiving or Word to paste tables, figures, and rationale into a GLP Final Report or Manuscript. Every report states why the method was selected.
What ToxGenie Analyzes.
Endpoint analysis and advanced statistics.
Click a module below for full methods, sample reports, and FAQs.
Get ECx, LCx, LDx, ICx and 95% CI in Minutes, Not Hours.
- Stop guessing which model to use.
- ToxGenie intelligently evaluates your input data (Quantal, Count, Quantitative, Ordinal).
- Automatically applies the optimal point estimation method.
Graphical Method
Applied when no partial mortalities exist and group reaches 100% mortality.
Moving Average-Angle Method
Applied when no partial mortalities exist but at least two group reaches 100% mortality.
Spearman-Karber Method
Requires a monotonically increasing response with exactly one partial mortality group.
Trimmed Spearman-Karber Method
Applied when the dose-response pattern is not monotonically increasing.
Logit Method
Applied when only 2–3 partial mortality groups are present.
Probit Method: Maximum Likelihood
Requires a minimum of 4 partial mortality groups with goodness-of-fit assessed by chi-square (χ²) test.
Linear and Non-Linear Regression Method
Applied exclusively to quantitative/continuous data, not binary mortality outcomes.
Automated Hypothesis Testing for NOEC & LOEC.
- ToxGenie doesn’t just give you a number.
- Automatically runs normality and homogeneity assessments.
- Automatically selects the correct parametric or non-parametric test.
- Provides a 100% transparent, statistically defensible decision path.
Outlier Detection
Performed to detect and handle extreme values that may distort statistical analysis.
Normality & Homogeneity Assessment
Evaluates whether data follows normal distribution and has equal variance across groups.
Automatic Data Transformation
Applied when data is non-normal or heterogeneous to meet parametric test assumptions.
A priori Comparisons
Pre-planned comparisons between control and treatment groups before statistical testing.
Parametric Test
Used when data is normally distributed with homogeneous variance (e.g. Dunnett’s test, t-test).
Non-Parametric Test
Applied for non-normal or heterogeneous data (e.g. Steel’s test, Wilcoxon rank sum test).
Beyond Endpoints: Advanced Statistics Built Strictly for Toxicology.
- Stop navigating bloated, general-purpose software.
- Focuses on OECD Test Guideline requirements.
- Input your data, and the software applies the correct statistical test.
Frequency Analysis
Evaluate the occurrence and distribution of quantal response data with Fisher’s Exact Tests or Chi-Square Test.
Dose-Response Trend Analysis
Identify dose-related trends using powerful tools like Cochran-Armitage (CA) Test, Jonckheere-Terpstra (JT) Test, and Linear Contrast F-Test to determine the direction of toxic effects.
Two Group Comparisons
Directly compare control vs. treatment groups using Student’s t-test (parametric) or Mann-Whitney U test (non-parametric) based on normality.
Multiple Group Comparisons
Execute comprehensive comparisons across multiple dose levels with ANOVA or Kruskal-Wallis, followed by automated post-hoc tests (Dunnett’s, Bonferroni, etc.).
Trend-based Multiple Group Comparisons
Perform step-down trend analysis to evaluate monotonic dose-response relationships by comparing treatment groups to a control. ToxGenie automatically applies appropriate statistical methods based on data distribution, including Williams’ test (for parametric data) or Shirley’s test (for non-parametric data).
Repeated Measures ANOVA
Analyze data collected from the same subjects over multiple time points to assess time and treatment effects. Following the initial analysis, automated post-hoc pairwise comparisons against a control group are executed using appropriate tests, such as Dunnett’s test, Steel’s test, Student’s t-test, or the Mann-Whitney U test.
Built by a toxicologist, for toxicologists.
ToxGenie comes from laboratory practice in ecotoxicology, not from generic software design.
OECD and US EPA logic is built in so you can stay on the science.
You focus on toxicology. Let ToxGenie handle the statistics.
Frequently Asked Questions
Is ToxGenie as scientifically rigorous as SAS, SPSS, or R?
Yes. ToxGenie uses the same classes of methods used in those tools—such as Dunnett’s test, Probit analysis, and non-linear regression. The difference is the interface: test selection and reporting are built for toxicity data, without coding or generic menus.
I have been using Excel for years. Why switch?
Excel can calculate, but it does not select the correct test for quantal versus continuous toxicity data, and it does not produce GLP-structured reports. ToxGenie applies guideline-aligned methods and writes the rationale automatically.
Which toxicity data types does ToxGenie support?
Quantal (e.g., mortality counts), Count (e.g., malformations or colonies), Quantitative/continuous (e.g., body weight, growth, or clinical chemistry), and Ordinal (e.g., histopathology severity, clinical signs, FOB scores).
Can I use ToxGenie on a Mac?
ToxGenie is built for Windows 10/11. Mac users may run it on a virtual machine such as Parallels.
Do you offer free licenses for students?
Master’s and Ph.D. students writing a thesis may receive a complimentary 1-year license. A second year is granted if, before the first year ends, you email us that the thesis has been submitted or is in preparation. Maximum: 2 years.
Ready to automate your toxicology analysis?
Join the researchers and GLP contract research organizations saving hours on every study.