BUILT FOR TOXICOLOGISTS
Pure Statistical Analysis for Toxicology Data
Stop adapting general statistical software to fit toxicology requirements. ToxGenie provides a streamlined, automated statistical analysis that strictly implements the most common analysis methods mandated by OECD and US EPA TG.
30-Day Free Trial • No Credit Card Required • Windows OS Only
QUANTAL DATA EVALUATION
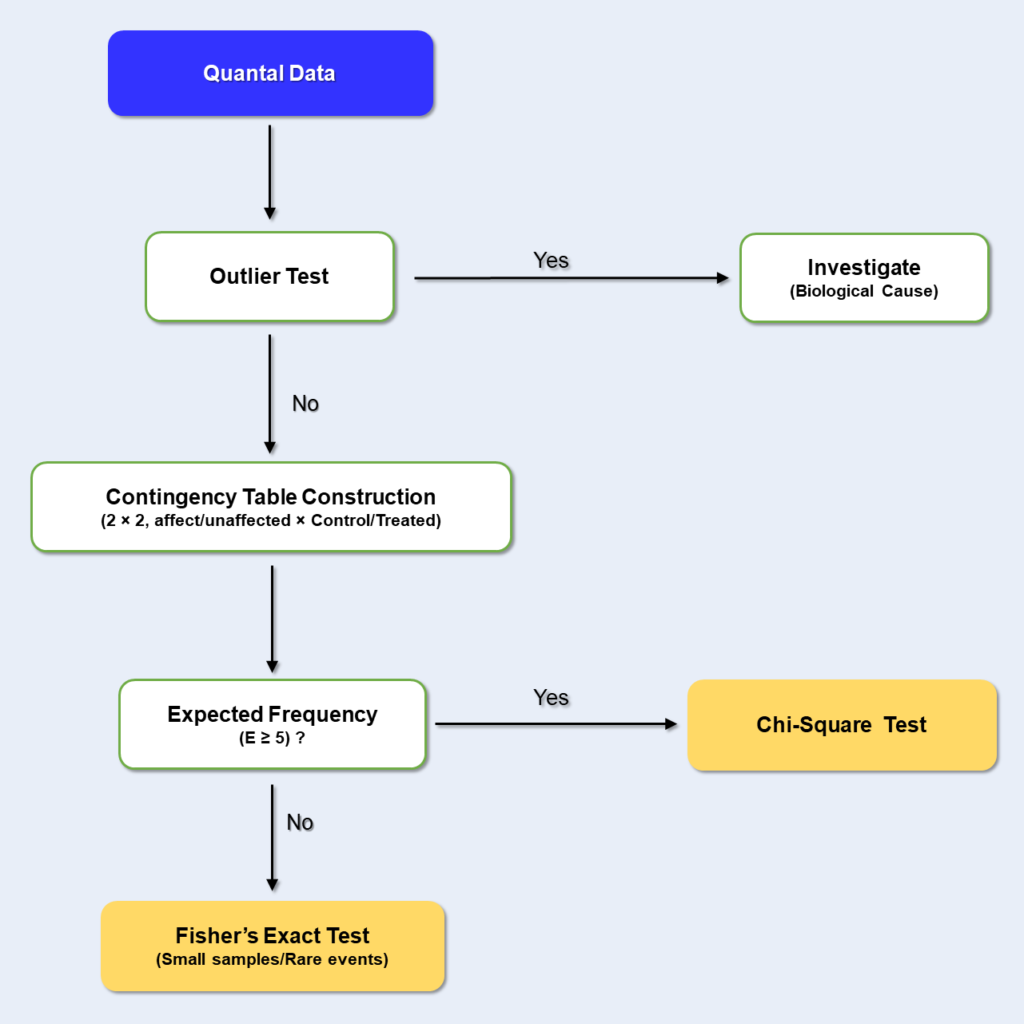
Statistical Analysis for Toxicology Data: Chi-Square & Fisher’s Exact
Accurately evaluate the occurrence and distribution of quantal response data (e.g., mortality, immobilization…). ToxGenie doesn’t just run tests; it validates the prerequisites.
Automated Pipeline:
- The engine constructs a 2×2 Contingency Table and rigorously checks the Expected Frequency (E).
- If E ≥ 5, it applies the Chi-Square Test.
- For small samples or rare events (E < 5), it automatically shifts to Fisher’s Exact Test to prevent statistical distortion.
Frequency Analysis
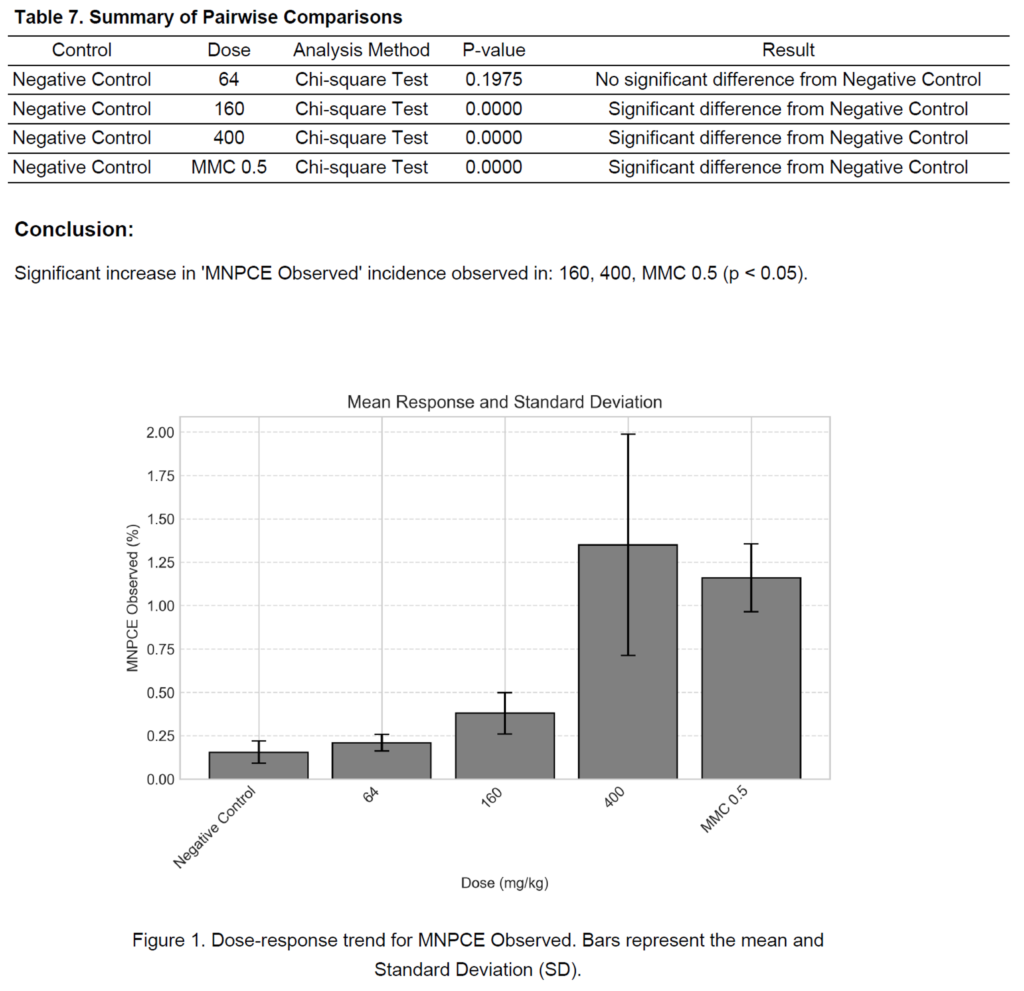
Automated Pairwise Comparisons
ToxGenie automatically conducts pairwise comparisons against the control, instantly calculating p-values to determine the statistical significance for each dose group.
Proven Accuracy and Reliability
ToxGenie yields results highly consistent with established methods, ensuring exceptional accuracy and reliability in its automated analysis.
DOSE-RESPONSE RELATIONSHIPS
Automated Trend Analysis for Toxic Effects
Determine the direction and statistical significance of toxic effects across increasing dose concentrations. ToxGenie deploys powerful tools to identify dose-related trends with absolute precision.
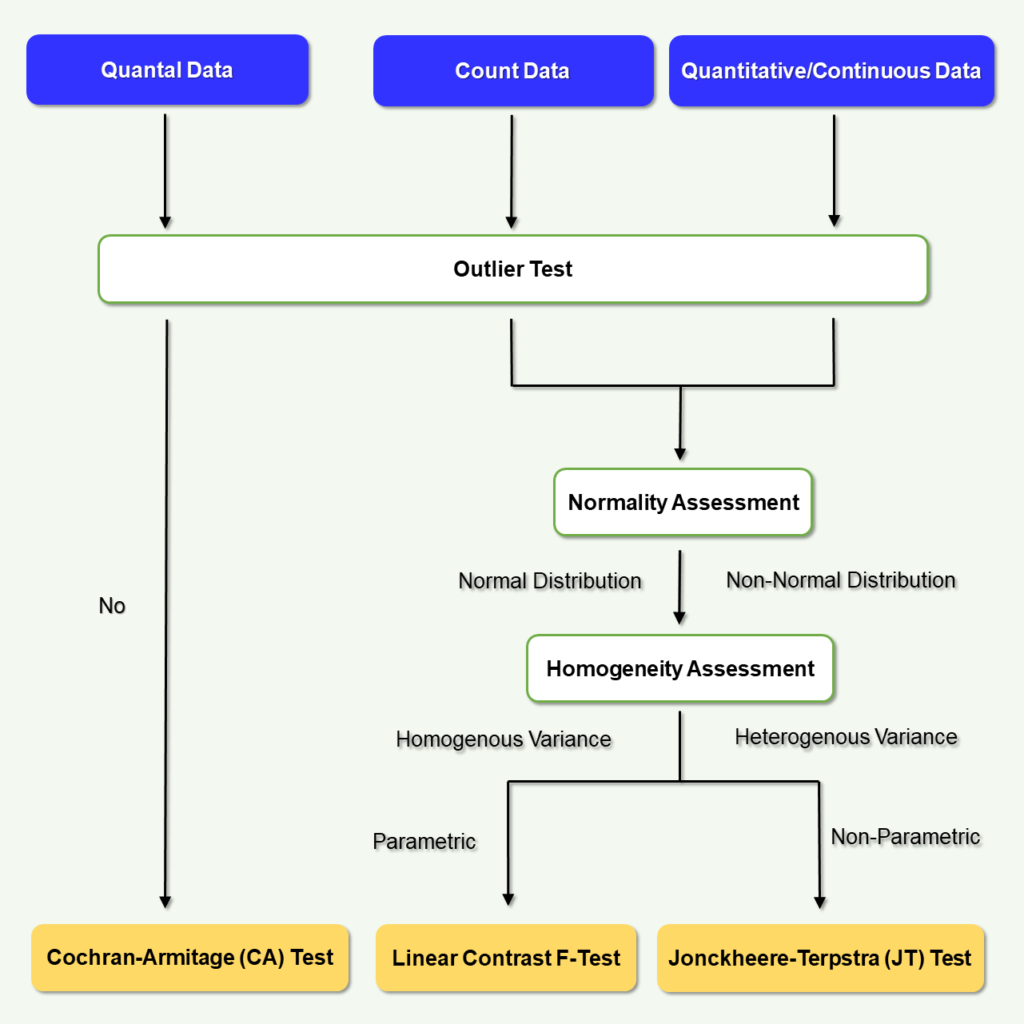
Step 1. Data Classification & Quantal Pathway
For Quantal Data (e.g., mortality rates), ToxGenie bypasses parametric assumptions and directly applies the Cochran-Armitage (CA) Test to identify linear trends in proportions.
Step 2. For Continuous & Count Data
The system must determine parametric viability. It executes rigorous Normality and Homogeneity Assessments on your original raw data.
Step 3. Transformation & Re-Assessment Loop
If raw data exhibits non-normality or heterogeneous variance, ToxGenie applies structural Data Transformations and re-evaluates:
Step 4. Final Trend Test Assignment
Based on the data classification and structural integrity validated in previous steps, the engine automatically assigns the correct statistical tool:
Trend Analysis
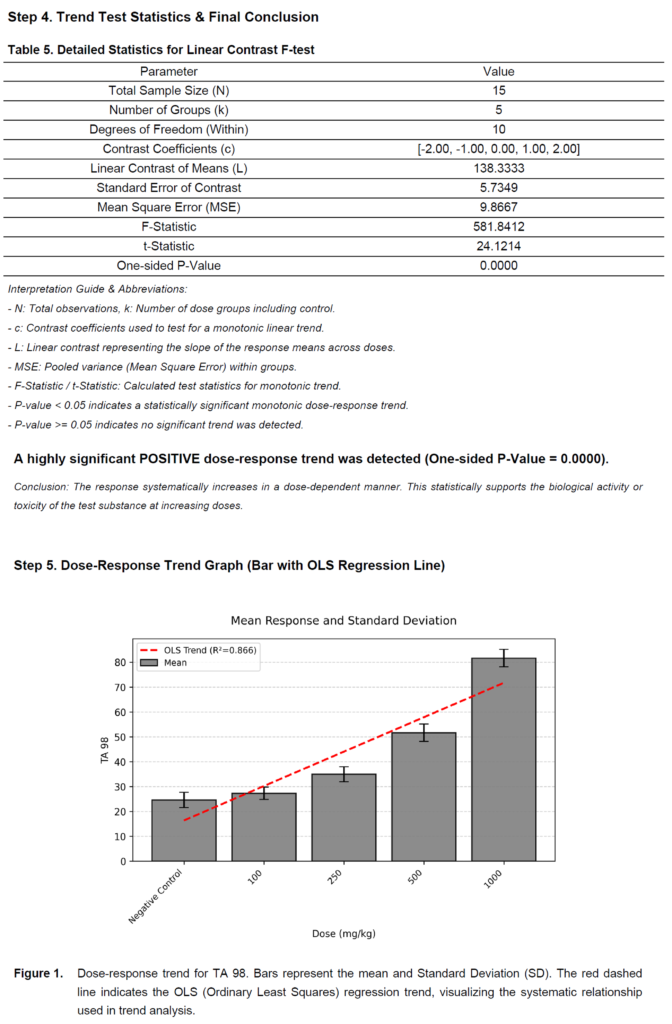
Detailed Statistics & Automated Conclusions
ToxGenie provides comprehensive statistical outputs, such as the Linear Contrast F-test, and automatically generates clear textual conclusions to confirm the presence of significant dose-response trends.
Proven Accuracy and Reliability
ToxGenie yields results highly consistent with established methods, ensuring exceptional accuracy and reliability in its automated analysis.
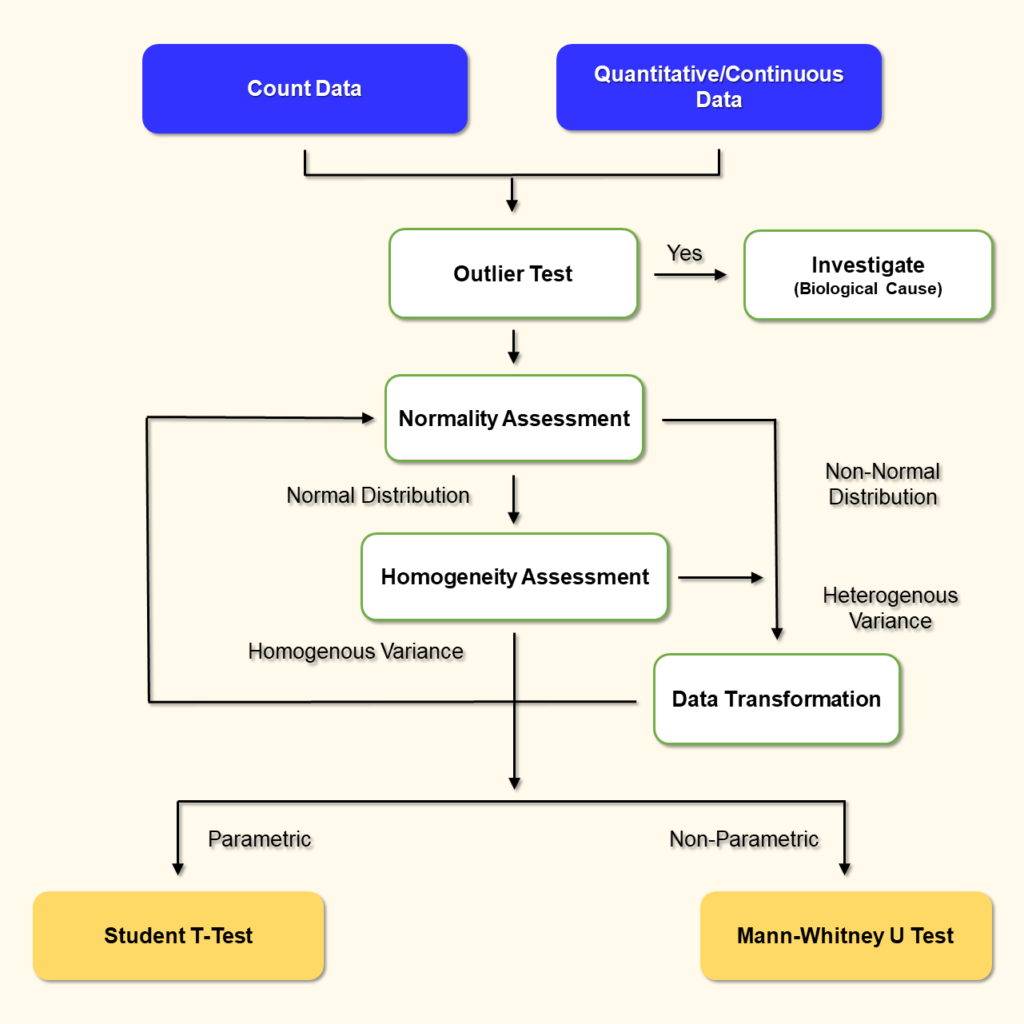
BASELINE VALIDATION & LIMIT TESTS
Two-Group Comparison for Limit Tests & Control Validation
Designed for single-dose Limit Tests and baseline control evaluations.
ToxGenie executes the required statistical pipeline to provide you with the exact rationale needed to defend your scientific decisions in peer-reviewed manuscripts and GLP final reports.
Statistical Rationale for Control Group Selection
Before initiating multi-dose evaluations, toxicity data analysis requires a validated baseline. When studies include both a Negative Control and a Solvent (Vehicle) Control, ToxGenie performs a rigorous Two-Group Comparison between them.
ToxGenie outputs the exact variance and p-values, empowering the investigator to make the final biological decision:
Pooling:
If the statistical output shows no significant difference, the researcher has the documented rationale to pool the controls to increase statistical power.
Single Baseline Selection:
If a significant difference is detected, the researcher can confidently justify using a single control (typically the Solvent Control) for downstream analysis, as mandated by regulatory guidelines.
Analytical Pipeline for Limit Tests
For standard Limit Tests (e.g., comparing a single treatment group directly against a control), ToxGenie executes the following strict evaluation tree on your Continuous and Count Data to determine the correct Limit Test.
Outlier Test & Biological Investigation
If anomalies are flagged, the system does not auto-delete them. It halts and prompts the investigator to determine the biological or technical cause, maintaining GLP data integrity.
Normality & Homogeneity Assessments
The raw data is strictly evaluated for Normal Distribution and Homogenous Variance to determine parametric viability.
Data Transformation
If the raw data exhibits non-normal distribution or heterogeneous variance, structural Data Transformation is applied, and the assumptions are re-assessed.
Final Limit Test Execution
Based on the structural properties validated in the preceding steps, ToxGenie calculates the final significance using:
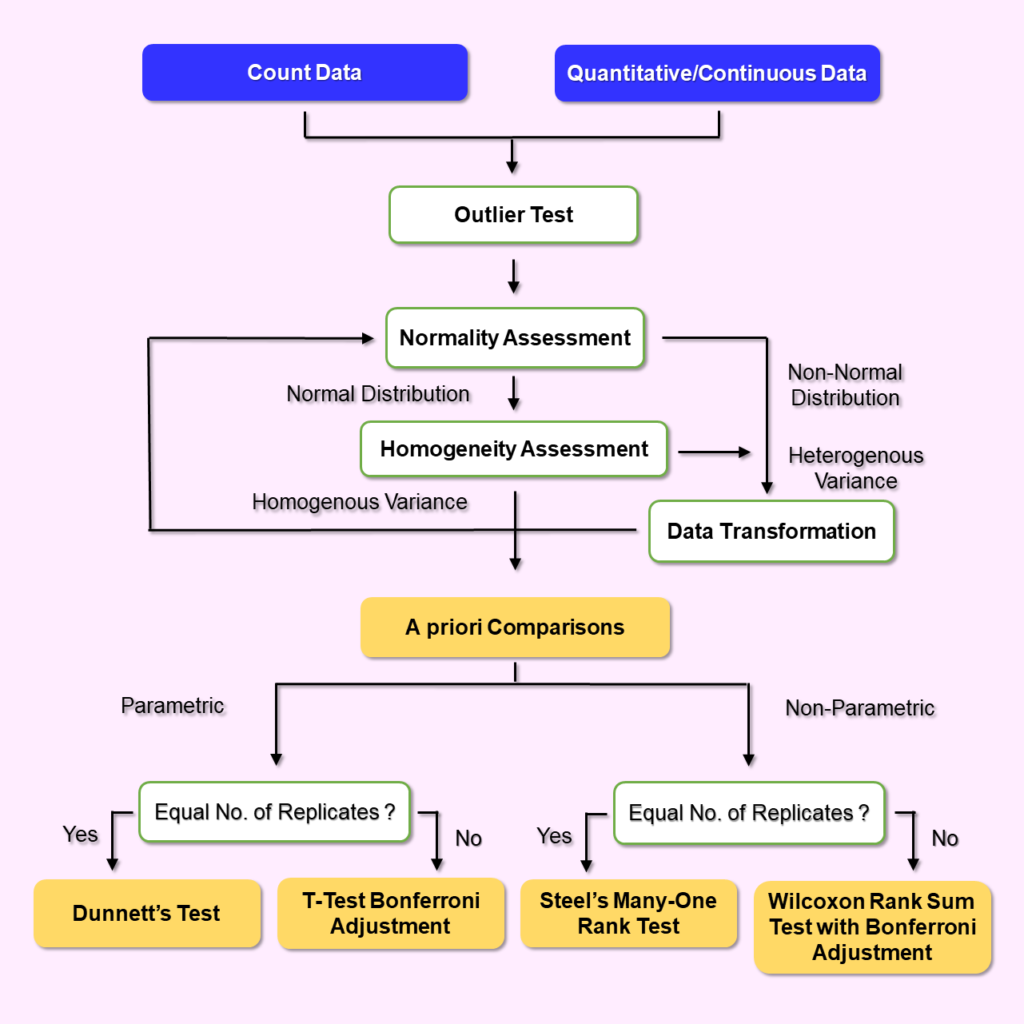
COMPREHENSIVE STATAITICAL ANALYSIS FOR MULTIPLE COMPARISON
Rigorous Multi-Group Comparison for Continuous & Count Data
Designed specifically for evaluating multiple treatment groups against a single control. ToxGenie executes a strict, multi-phase statistical decision tree to ensure your comparative analysis is completely defensible for peer-reviewed publications.
Maintaining Integrity with Unequal Replicates
In biological assays, subjects are occasionally lost, leading to unequal numbers of replicates across groups. Applying standard post-hoc tests (like Dunnett’s) to unbalanced data compromises statistical integrity.
ToxGenie outputs the exact variance and p-values, empowering the investigator to make the final biological decision:
ToxGenie's Solution
Before assigning a final comparison test, the engine actively evaluates replicate equality. If an imbalance is detected, it automatically applies precise Bonferroni adjustments to control the Type I error rate, strictly maintaining methodological validity.
Statistical Decision Tree
Every mathematical assumption is strictly validated to route your data to the correct parametric or non-parametric pathway.
PHASE 1. Outlier Screening
The engine identifies anomalies, prompting the investigator to investigate technical or biological causes before analysis proceeds.
PHASE 2. Normality & Homogeneity Assessments
Raw data is evaluated for Normal Distribution and Homogenous Variance. If assumptions fail, Data Transformation is applied. Transformed data is re-assessed.
PHASE 3. A priori Comparisons
To prevent false positives, overall significance testing is conducted prior to pairwise comparisons. The engine applies ANOVA (Parametric) or Kruskal-Wallis (Non-Parametric).
PHASE 4. Post-hoc Routing
Following the A priori test, the system evaluates the number of replicates to assign the statistically appropriate post-hoc comparison method.
Built by Toxicologists, for Toxicologists.
ToxGenie is continuously evolving. While our current suite covers the strict requirements of major analytical methods, your specific research might require specialized methodologies.
Do you need a specific statistical test or feature not listed here? Let us know. We actively update our engine based on requests from the global toxicology community.
STATISTICAL DOCUMENTATION
Generate Publication-Ready Statistical Reports.
ToxGenie eliminates the “Black Box.” Generate comprehensive statistical reports that include the exact rationale for model selection.
User-Selected Formats
Output your final report in either PDF (for secure, audit-ready archiving) or MS Word, depending on your current needs.
Manuscript & GLP Ready
Highly requested by our beta testers. Export to MS Word to seamlessly copy and paste the statistical rationale, tables, and graphs directly into your GLP Final Reports or academic papers.
Defensible Rationale
Every report explicitly justifies why a specific statistical method was applied, providing you with perfect defensibility for regulatory submissions (OECD, EPA).
How is ToxGenie different from general statistical software (SPSS, R) for toxicity data?
General software requires you to manually script the pipeline: checking outliers, assessing normality, transforming data, and selecting the final test. ToxGenie automates this entire decision tree strictly based on OECD/US EPA guidelines. You simply upload data; the engine handles the statistical rigor and outputs a publication-ready rationale.
What statistical tests does ToxGenie use for toxicity data analysis?
ToxGenie covers the four major categories mandated by global guidelines: Frequency Analysis (Chi-Square, Fisher’s Exact), Trend Analysis (Cochran-Armitage, JT Test, F-Test), Two-Group Comparison (Student’s t, Mann-Whitney U), and Multi-Group Comparison (Dunnett’s, Steel’s, Wilcoxon, Bonferroni adjustments).
Why are A priori comparisons (ANOVA/Kruskal-Wallis) required before post-hoc tests?
Standard statistical rigor requires establishing an overall significant difference across all groups before conducting pairwise comparisons against a control. This vital step controls the Family-wise Error Rate, a requirement strictly evaluated during the peer-review process.
Ready to automate your toxicology analysis?
Join the researchers and GLP contract research organizations saving hours on every study.