AUTOMATED NOEC & LOEC DETERMINATION
Hypothesis Tests for Every Data Type.
Stop guessing between parametric, or non-parametric tests. ToxGenie evaluates your data’s properties, checks assumptions, and automatically routes Quantal, Count, and Quantitative data to the statistically defensible test.
30-Day Free Trial • No Credit Card Required • Windows OS Only
Outlier Screening
The process begins with an Outlier Test. If anomalies are detected, the system intelligently flags them, prompting you to investigate potential biological causes.
Contingency Table Construction
If the data passes the outlier check, ToxGenie automatically constructs a strict 2 × 2 contingency table (Affected/Unaffected × Control/Treated).
Expected Frequency Evaluation
The engine assesses the expected frequency (E) in the contingency table to assign the correct test:
- If E ≥ 5: Data is routed to the Chi-Square Test to accurately estimate NOEC and LOEC.
- If E < 5: For small samples or rare events, the system automatically shifts to Fisher’s Exact Test to calculate highly reliable NOEC and LOEC values without statistical distortion.
The Multi-Phase Validation Pipeline
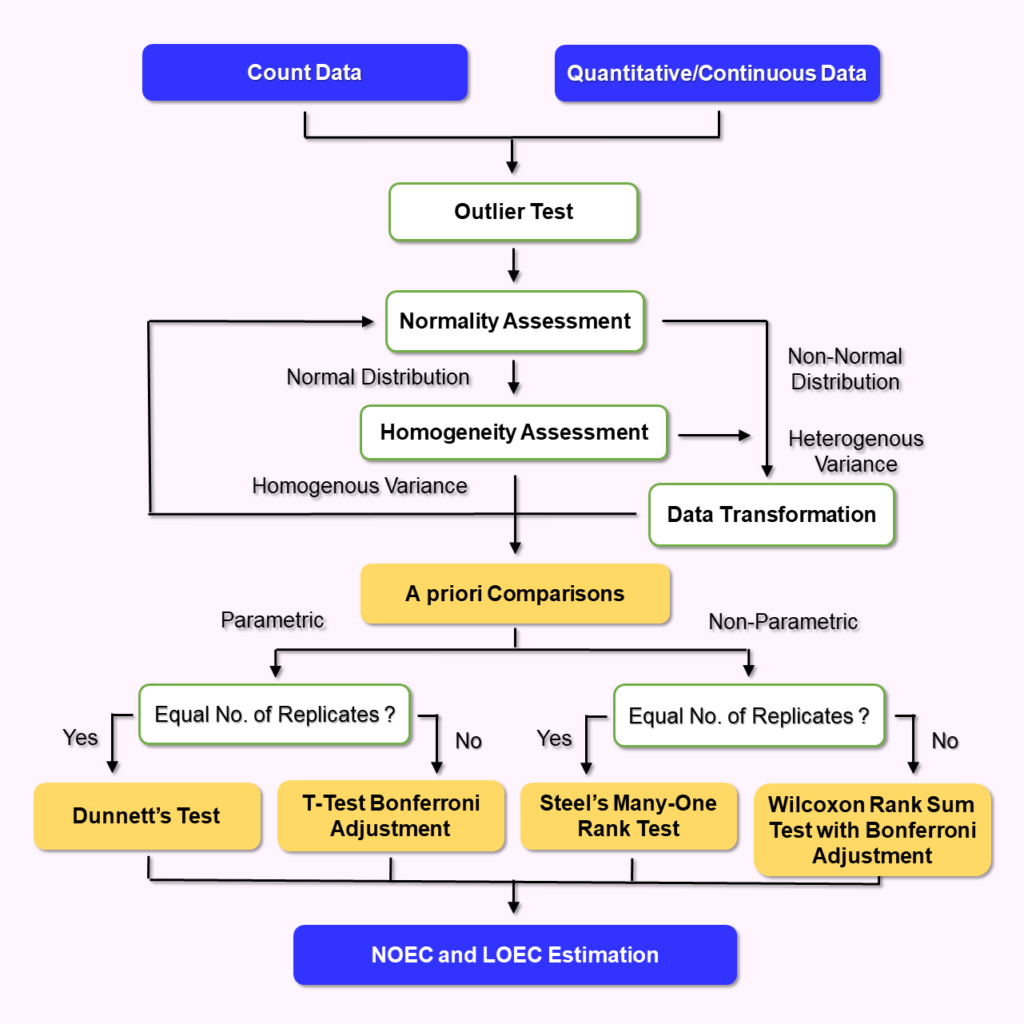
For Count and Quantitative/Continuous data, ToxGenie leaves no room for error. Every mathematical assumption is tested, re-tested, and verified before a final hypothesis test (NOEC and LOEC) is assigned.
Step 1. Initial Assessment
The engine identifies anomalies via an Outlier Test, followed by rigorous Normality and Homogeneity Assessments on your original raw data.
Step 2. Initial Assessment
If raw data exhibits non-normality or heterogeneous variance, ToxGenie applies structural Data Transformations. Crucially, it then re-evaluates the transformed data:
Step 3. Transformation & Re-Assessment Loop
With the data’s structural integrity validated, the system conducts necessary A priori Comparisons to set the baseline for the final post-hoc tests.
Step 4. Replicate Evaluation & Final Test Assignment
Finally, the engine checks for equal numbers of replicates across treatment groups to deploy the exact hypothesis test:
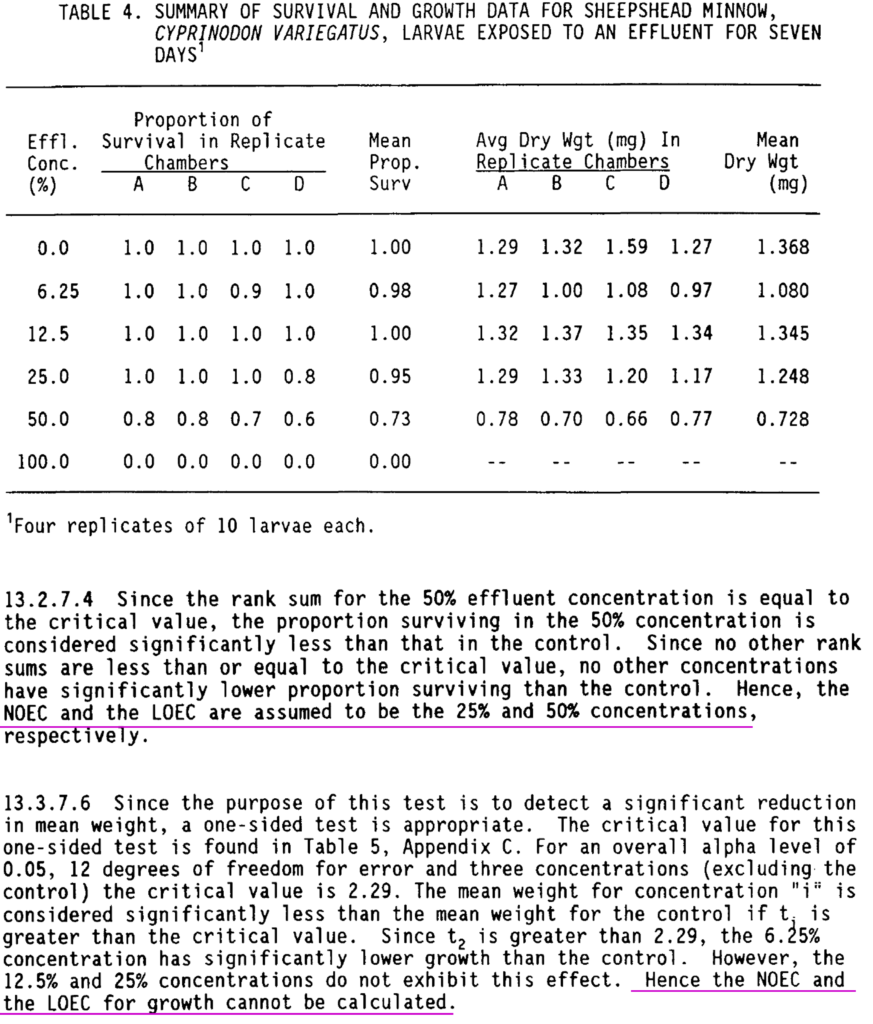
Perfect US EPA Alignment. Total Trust.
We processed identical toxicity datasets from official US EPA Report(EPA/600/4-91/022), and ToxGenie’s outcomes matched perfectly. This proven consistency ensures you can fully trust ToxGenie with your most critical scientific data.
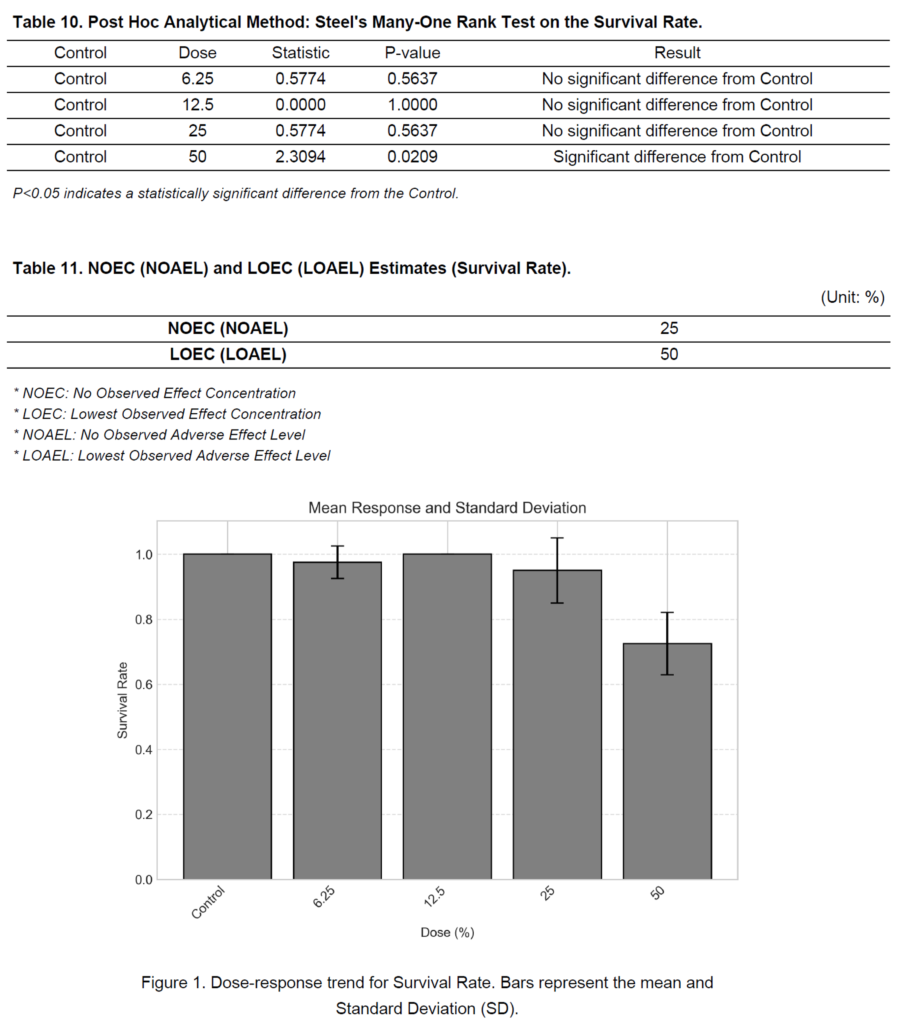
Survival Data Analysis
Steel's Many-One Rank Test
ToxGenie analyzes the characteristics of the input data and automatically selects Steel’s Many-One Rank Test based on a decision tree.
Proven Accuracy and Reliability
ToxGenie yields results highly consistent with established methods, ensuring exceptional accuracy and reliability in its automated analysis.
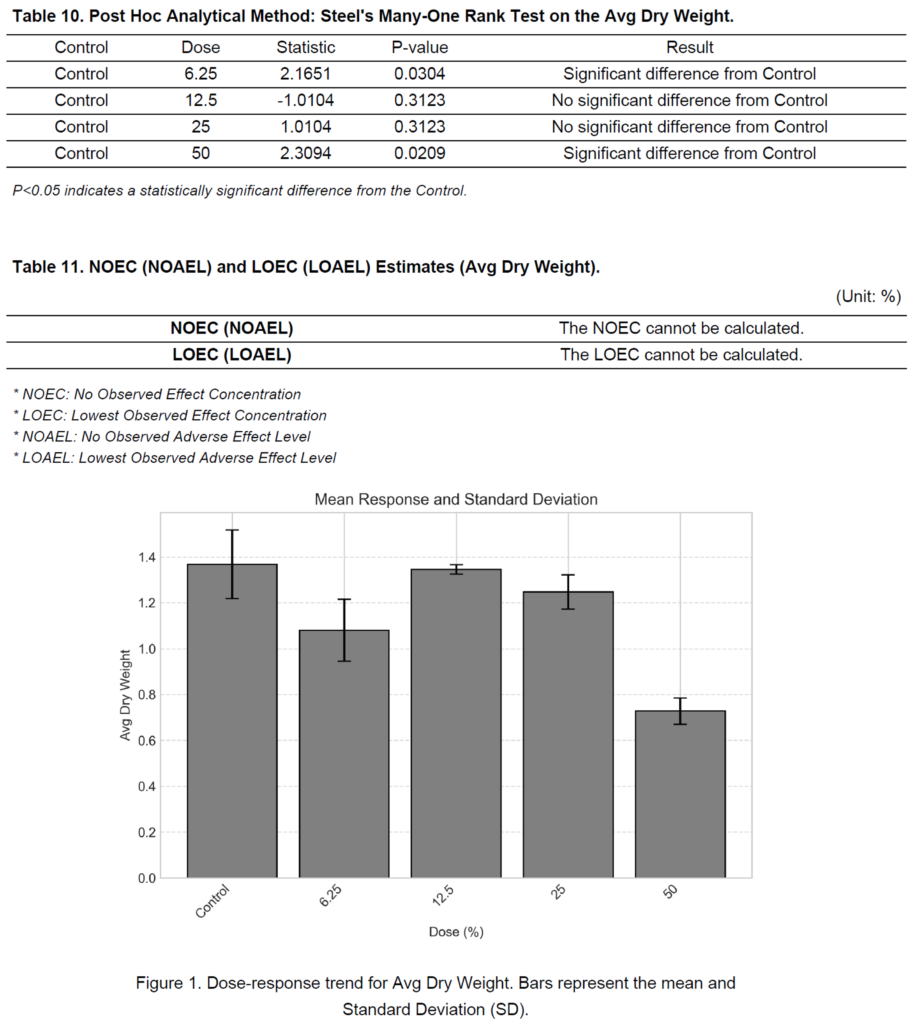
Growth Data Analysis
Steel's Many-One Rank Test
ToxGenie analyzes the characteristics of the input data and automatically selects Steel’s Many-One Rank Test based on a decision tree.
Proven Accuracy and Reliability
ToxGenie yields results highly consistent with established methods, ensuring exceptional accuracy and reliability in its automated analysis.
Fully Traceable. Publication-Ready.
ToxGenie eliminates the “Black Box.” Generate comprehensive statistical reports that include the exact rationale for model selection.
User-Selected Formats
Output your final report in either PDF (for secure, audit-ready archiving) or MS Word, depending on your current needs.
Manuscript & GLP Ready
Highly requested by our beta testers. Export to MS Word to seamlessly copy and paste the statistical rationale, tables, and graphs directly into your GLP Final Reports or academic papers.
Defensible Rationale
Every report explicitly justifies why a specific statistical method was applied, providing you with perfect defensibility for regulatory submissions (OECD, EPA).
How does ToxGenie decide between Chi-Square and Fisher's Exact Test?
For quantal data, ToxGenie evaluates the contingency tables. If expected frequencies fall below the statistical threshold or sample sizes are small, it automatically bypasses Chi-Square and utilizes Fisher’s Exact Test to prevent inaccurate probability estimations.
What happens if data fails Normality/Homogeneity even after transformation?
If transformed data fails re-assessment, ToxGenie prevents statistical distortion. It discards the transformation, reverts back to your original raw data, and safely routes the analysis through robust Non-Parametric methods (e.g., Steel’s or Wilcoxon).
Does the system handle unequal replicates due to lost subjects?
Yes. ToxGenie automatically detects replicate imbalances. Instead of applying invalid standard tests like Dunnett’s, it applies appropriate adjustments—such as the T-Test or Wilcoxon Rank Sum Test with Bonferroni Adjustment—maintaining absolute statistical rigor.
Ready to automate your toxicology analysis?
Join the researchers and GLP contract research organizations saving hours on every study.