

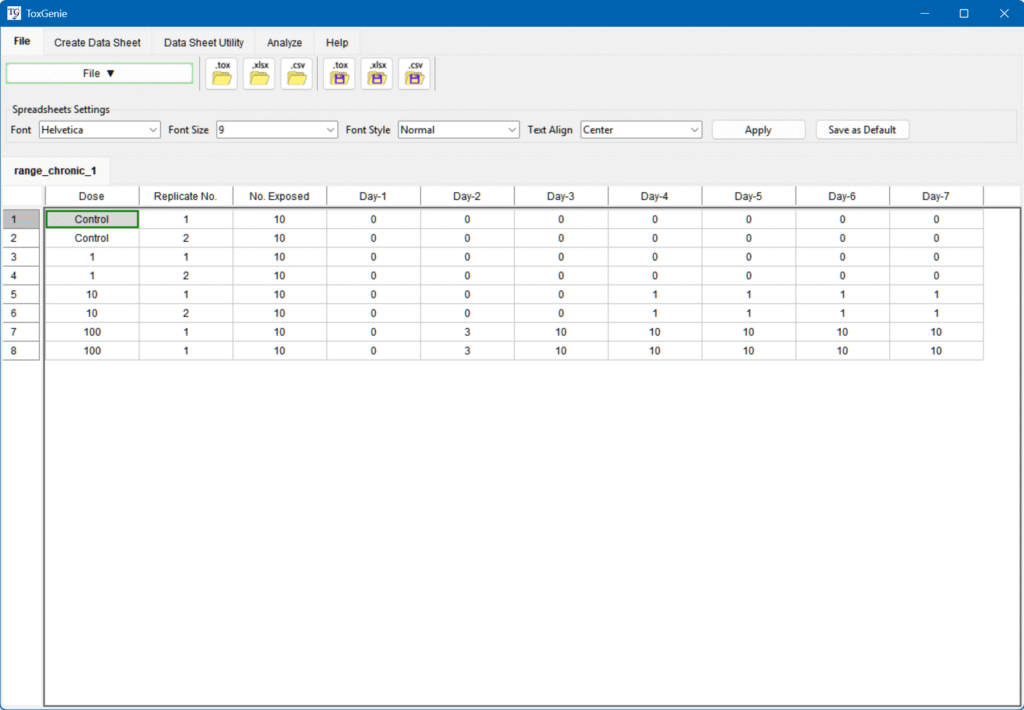
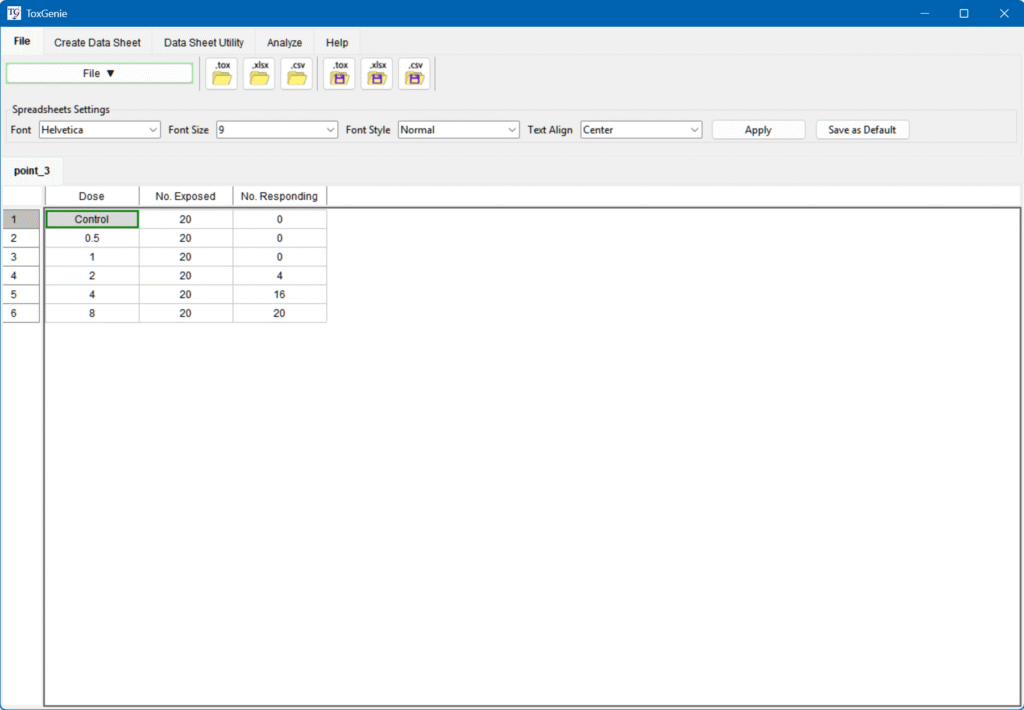
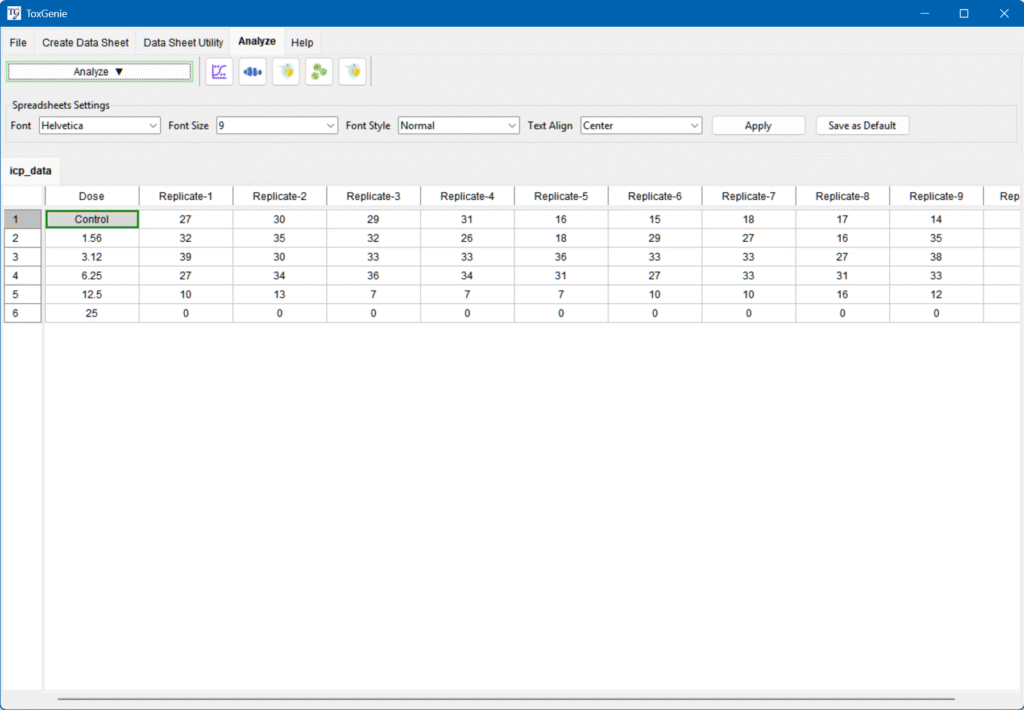
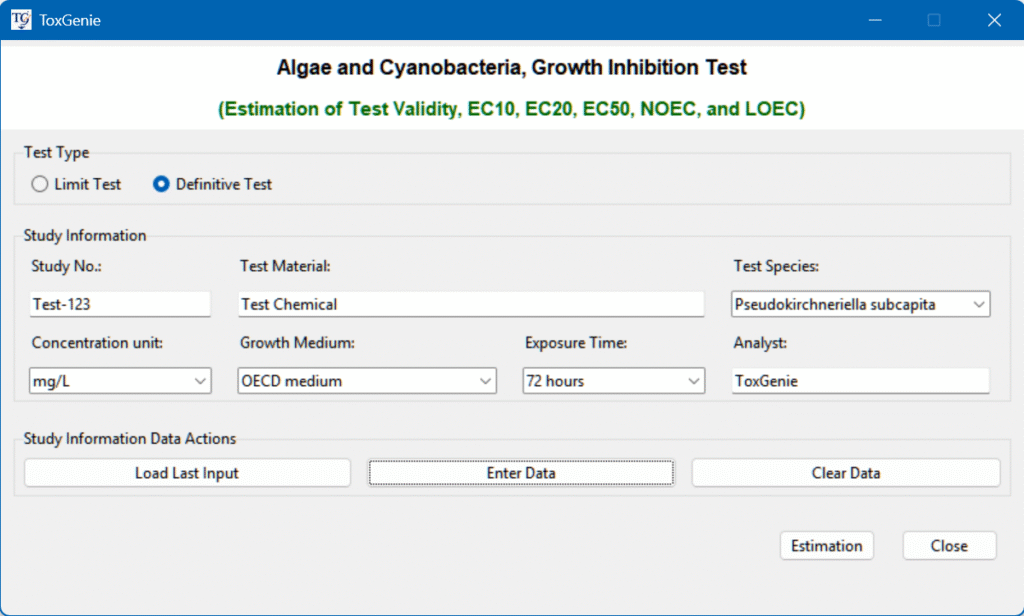
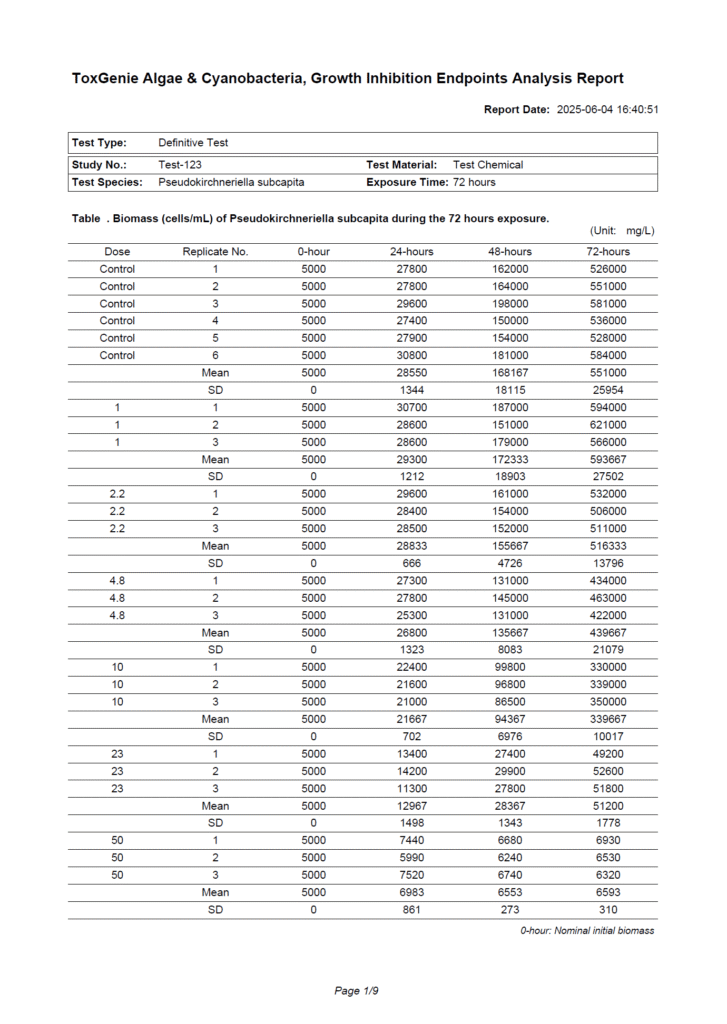
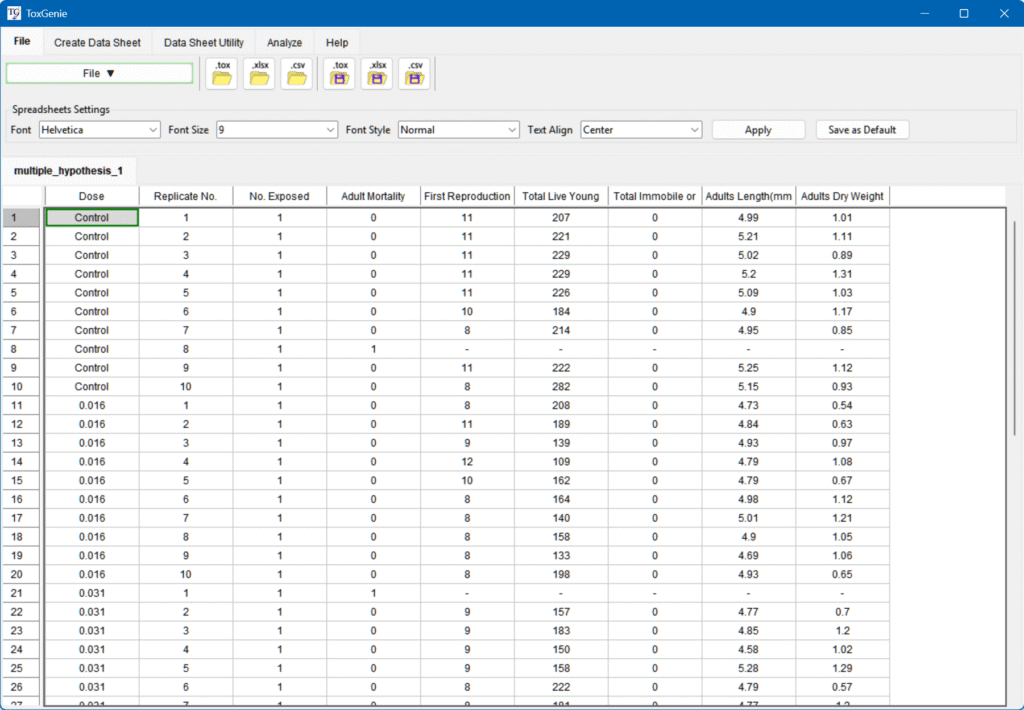
Enter Your Data

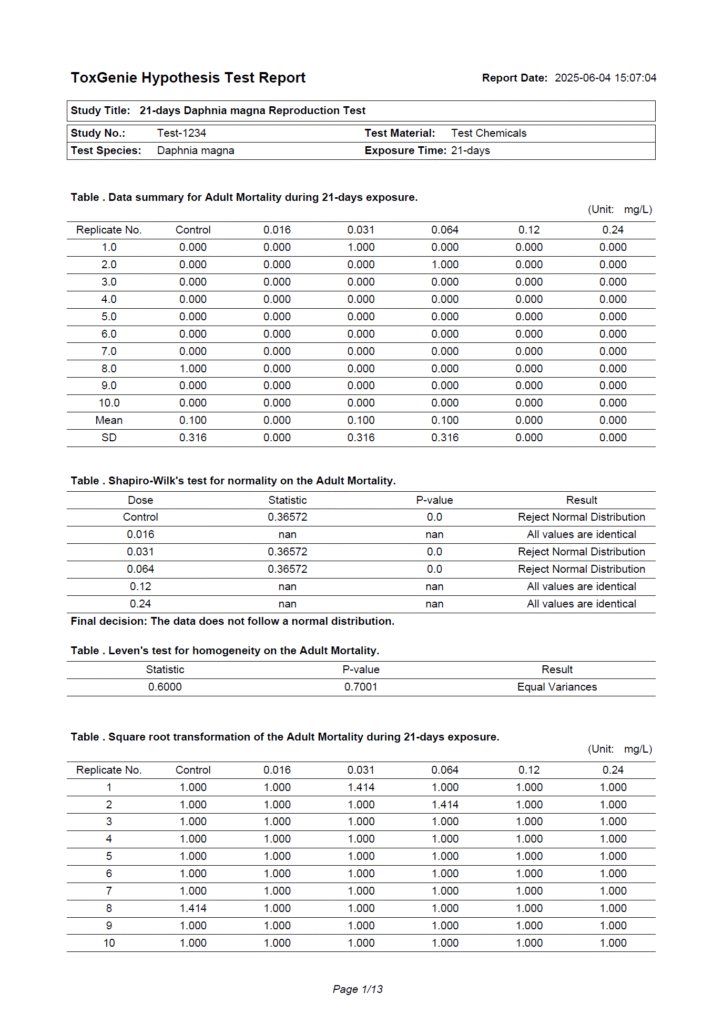
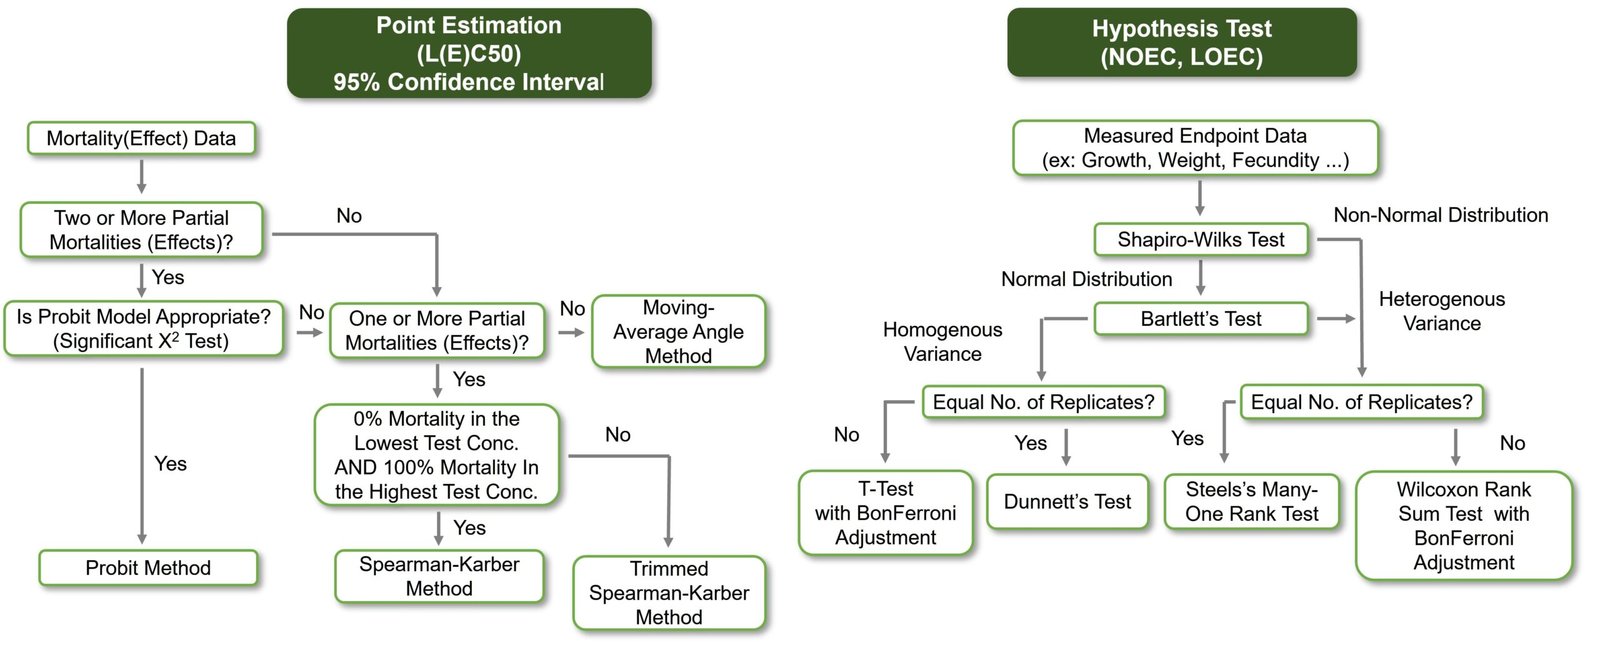
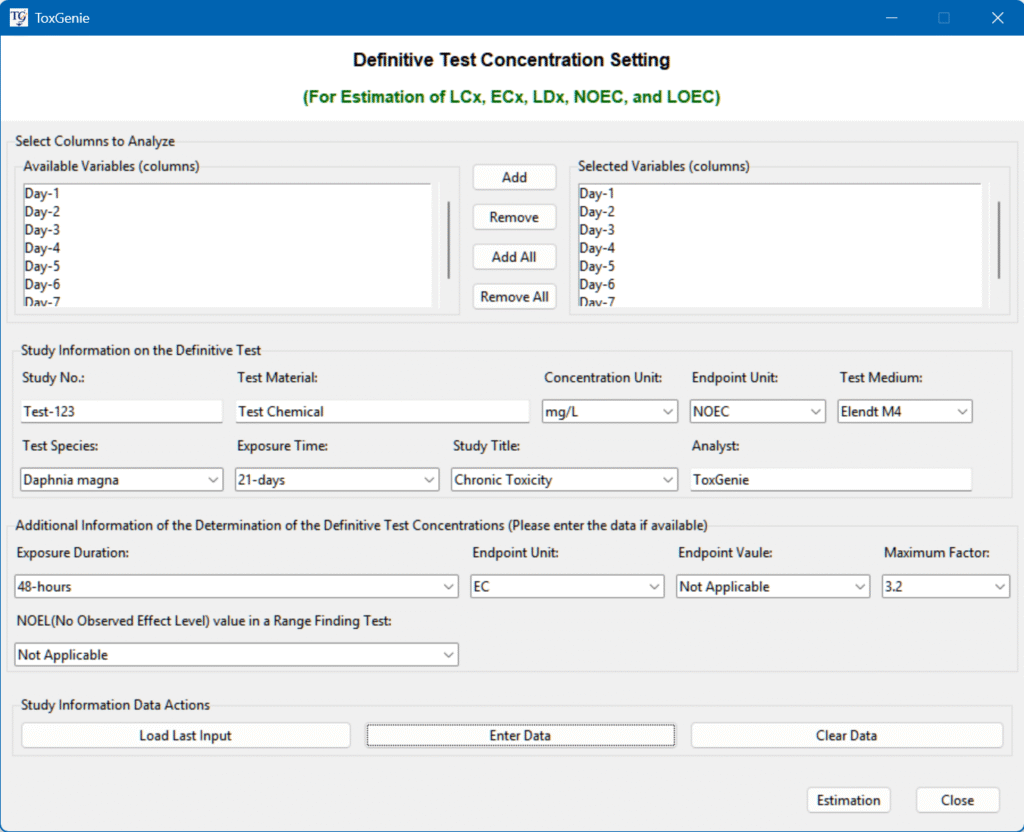
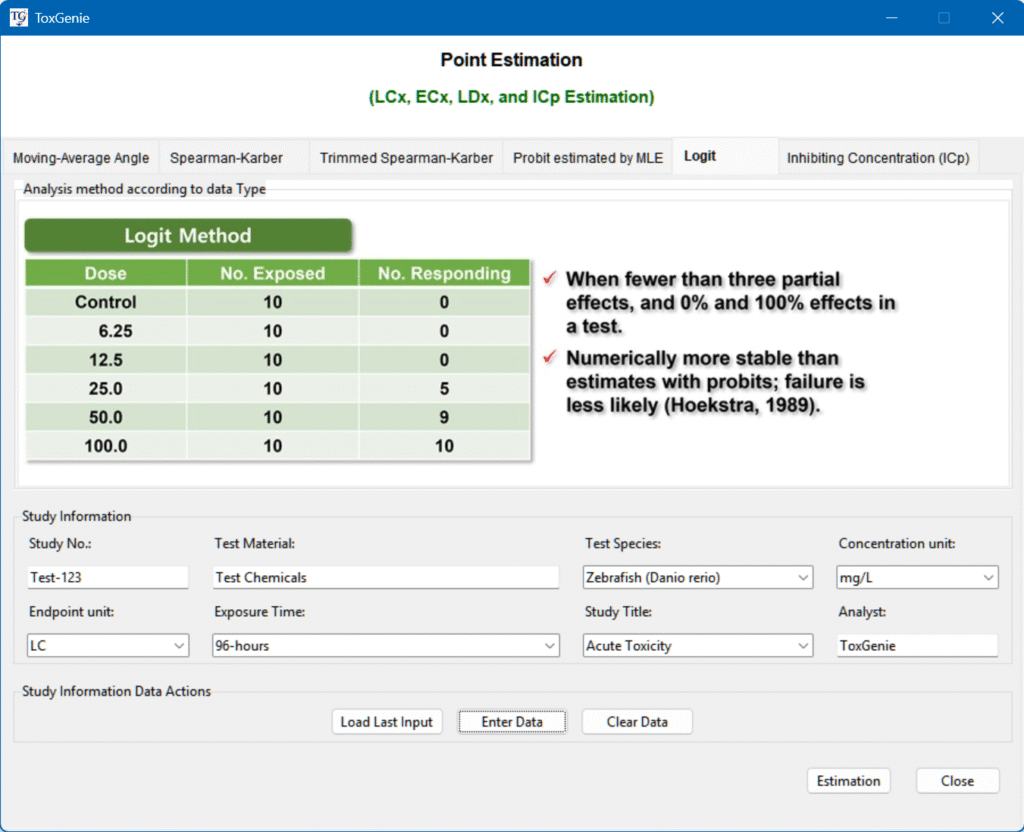
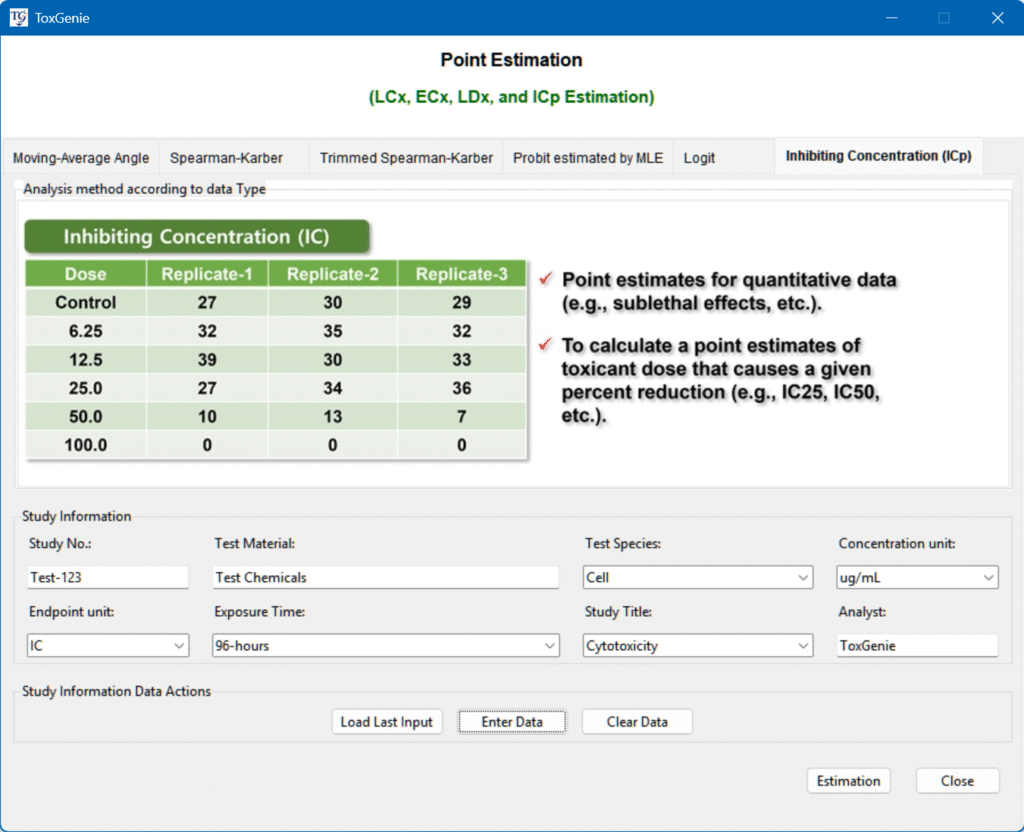
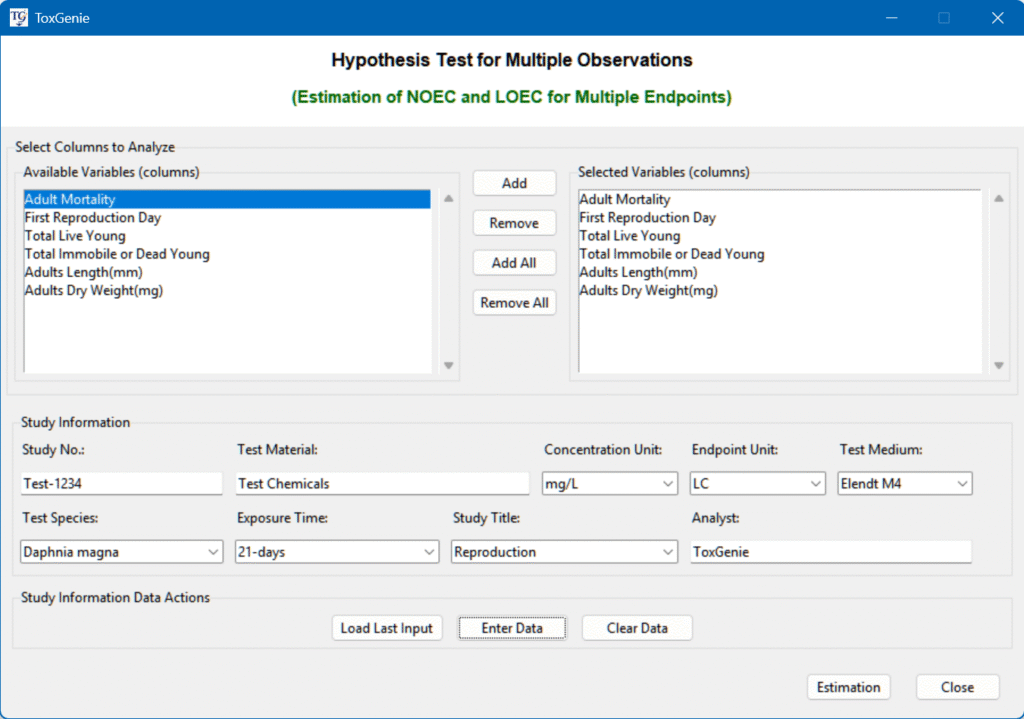
Run Estimation

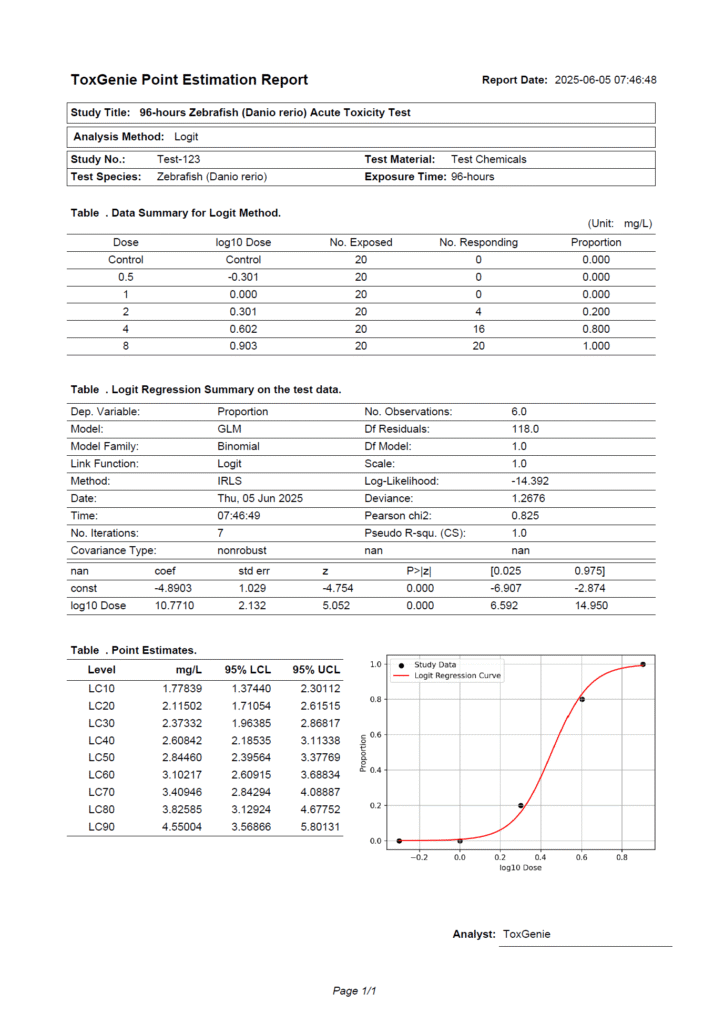
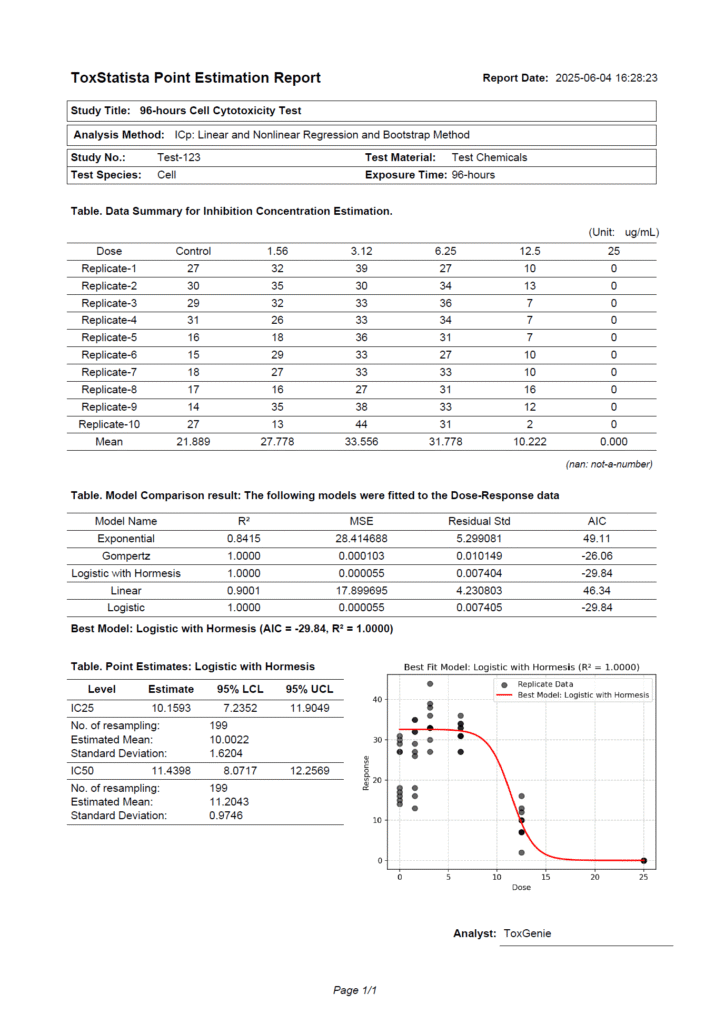
Generate Report Automatically
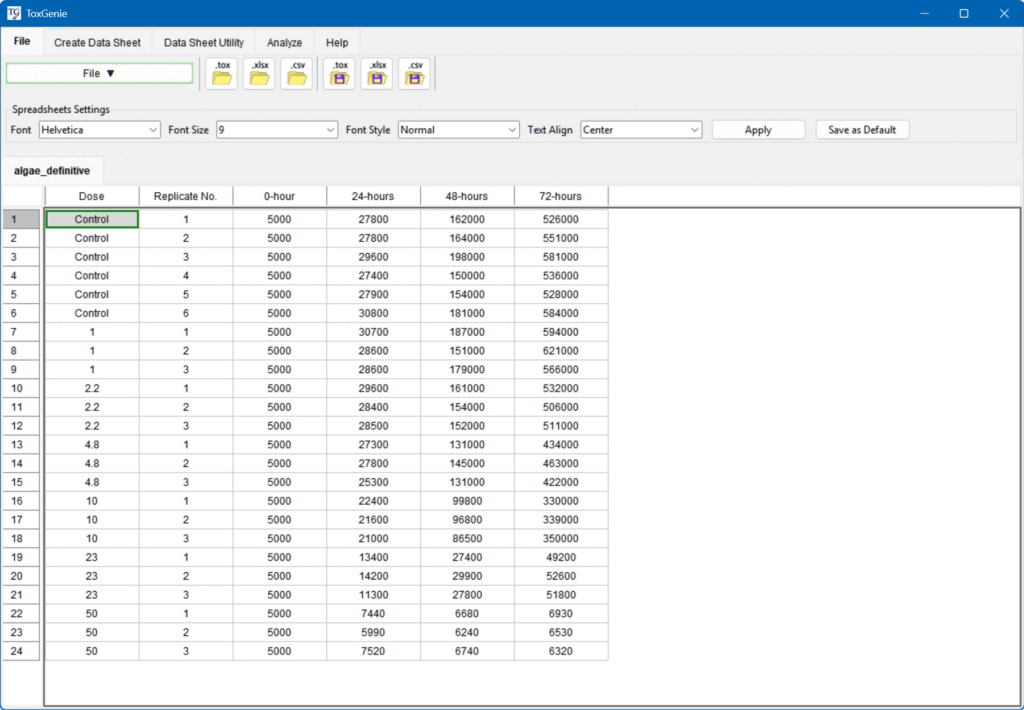
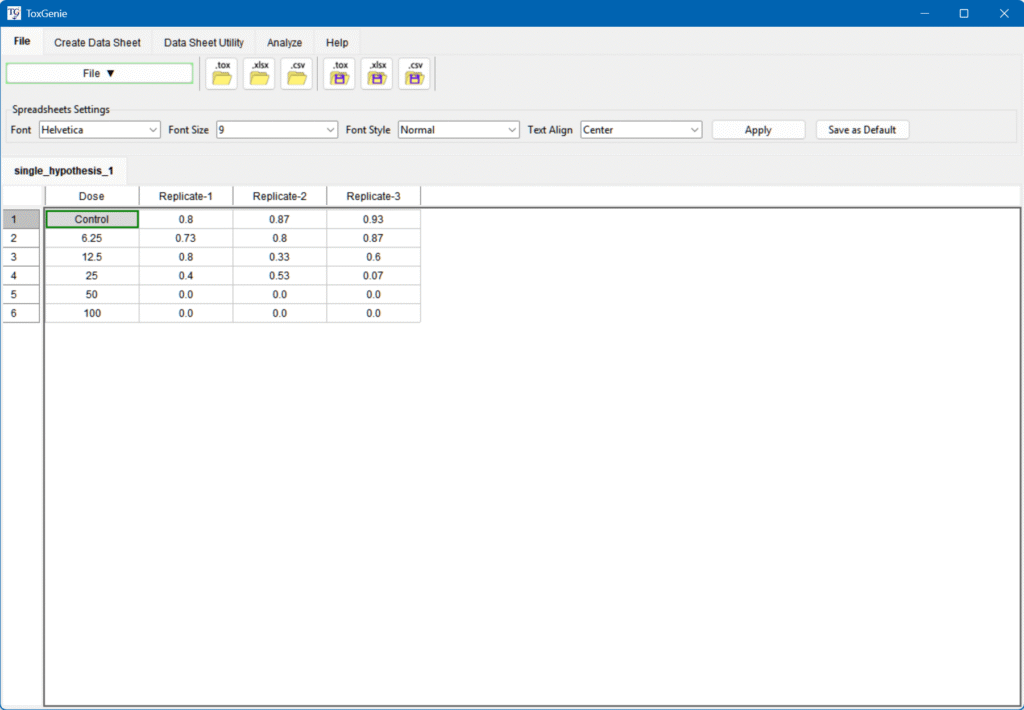
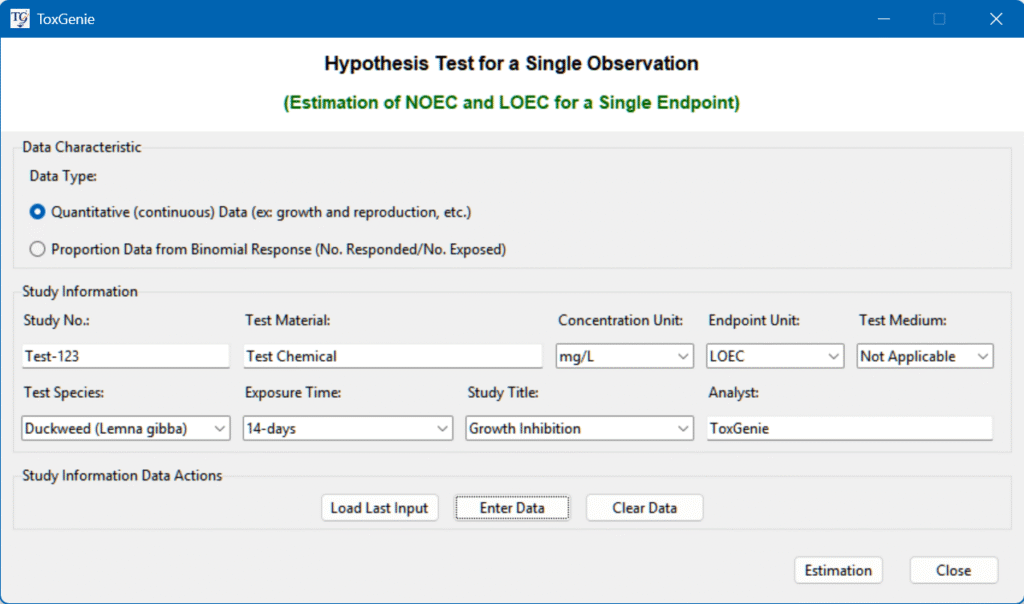
Enter Your Data
Run Estimation
Generate Report Automatically
Enter Your Data
Run Estimation
Generate Report Automatically
Enter Your Data
Run Estimation
Generate Report Automatically
Enter Your Data
Run Estimation
Generate Report Automatically
Enter Your Data
Run Estimation
Generate Report Automatically