In toxicological studies, evaluating whether the variances of quantitative toxicity data are homogeneous across groups is critical for hypothesis testing. This is particularly important because statistical methods like Analysis of Variance (ANOVA), commonly used to determine No-Observed-Effect Concentration (NOEC) and Lowest-Observed-Effect Concentration (LOEC), assume that variances are equal across groups (homogeneity of variance). To ensure robust statistical analysis, toxicity tests should be designed with a minimum of three replicates for both control and treatment groups.
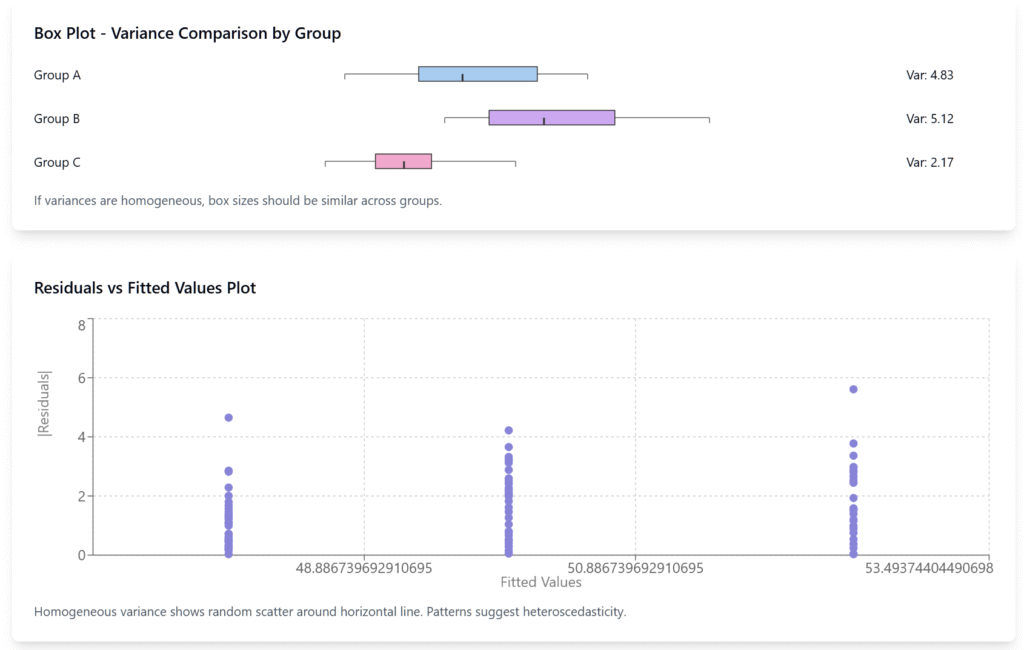
Homogeneity of Variance Test Visualization
What is Homogeneity of Variance?
Homogeneity of variance refers to the condition where the variance of data is consistent across different groups. This is a key assumption for parametric statistical tests like ANOVA, ensuring that data variability is comparable between groups.
Why is a Homogeneity Test Important?
In toxicology, quantitative endpoints such as reproduction and growth require homogeneous variances to ensure reliable statistical analysis and accurate determination of NOEC and LOEC values. If variances are not homogeneous, it can lead to erroneous conclusions, necessitating alternative approaches such as data transformation (e.g., logarithmic transformation) or non-parametric tests.
How is a Homogeneity Test Performed?
Several methods exist to assess homogeneity of variance, with Levene’s Test being the most commonly used in ecotoxicological studies due to its robustness across various data distributions. This test evaluates whether variances are equal across groups and provides a p-value:
- p-value > 0.05: Indicates that variances are homogeneous, allowing the use of parametric tests like ANOVA.
- p-value < 0.05: Suggests that variances are not homogeneous, indicating the need for data transformation or non-parametric tests.
Bartlett’s Test is another option but is more sensitive to deviations from normality, which can affect its reliability if the normality assumption is not met. Additionally, visual tools such as boxplots or residual plots can be used to inspect variance homogeneity.
Start Your Toxicity Data Analysis with ToxGenie
Understanding quantal and quantitative data is the first step to robust toxicology research. Our software offers an intuitive platform for both data types, perfect for beginners and experts alike. Curious? Start with a 30-day free trial and revolutionize your toxicity data analysis today!