Preparation for IC25 and IC50 Estimation
As with all statistical analysis of toxicity data, it is critical to visualize the experimental data distribution through graphing.
A minimum of three replicates is necessary in a toxicity test to enable the calculation of IC25 and IC50.
ToxGenie automatically identifies user-input data and selects the optimal model from among exponential, Gompertz, hormesis, linear, and logistic models for analysis. Therefore, you only need to input your experimental data.
What is the Exponential Model?
The exponential model is a mathematical formula that assumes the effect (inhibition rate) increases more rapidly as the concentration increases. In simple terms, it suggests that as the amount of a substance increases incrementally, its biological impact can grow exponentially. This model is expressed as follows (Environment Canada, 2005).
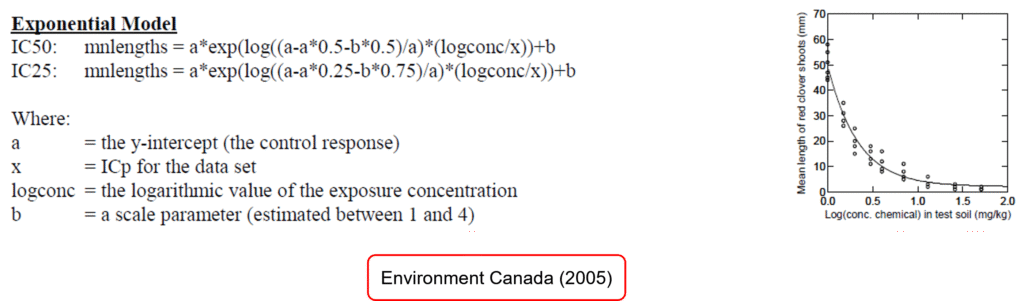
The Weibull distribution is a generalized version of the exponential model. It can be used for empirical fitting of dose-response data. The distribution is sigmoidal but allows the shape of the curve to vary above and below the inflection point, offering an advantage over probit or logit distributions.
Analysis Results of ToxGenie’s IC25 and IC50 Estimation
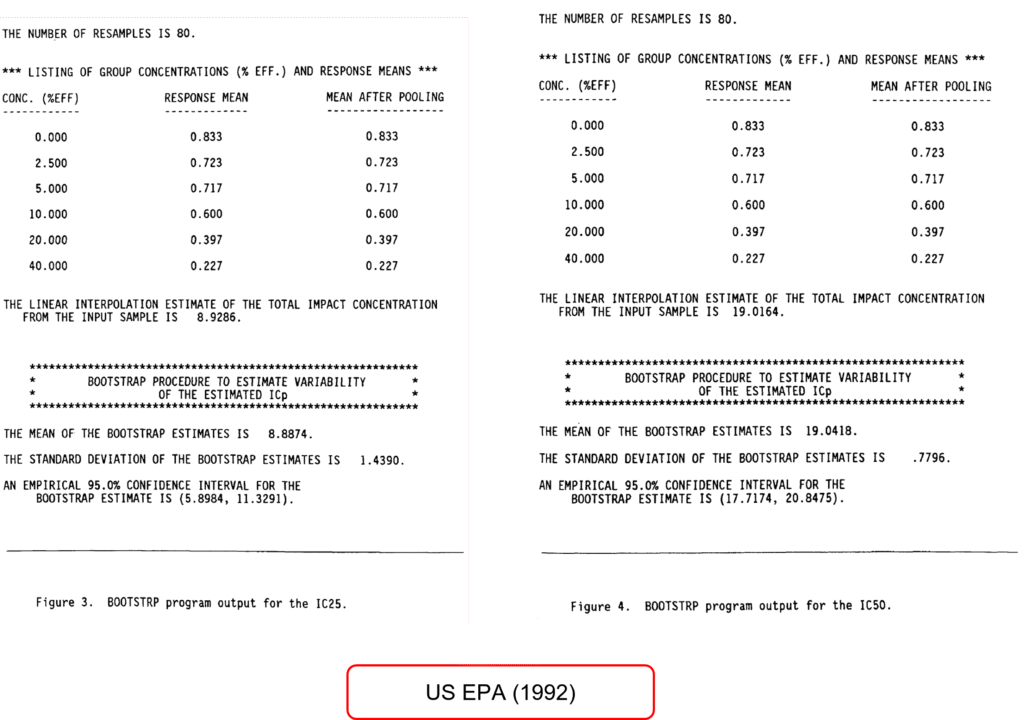
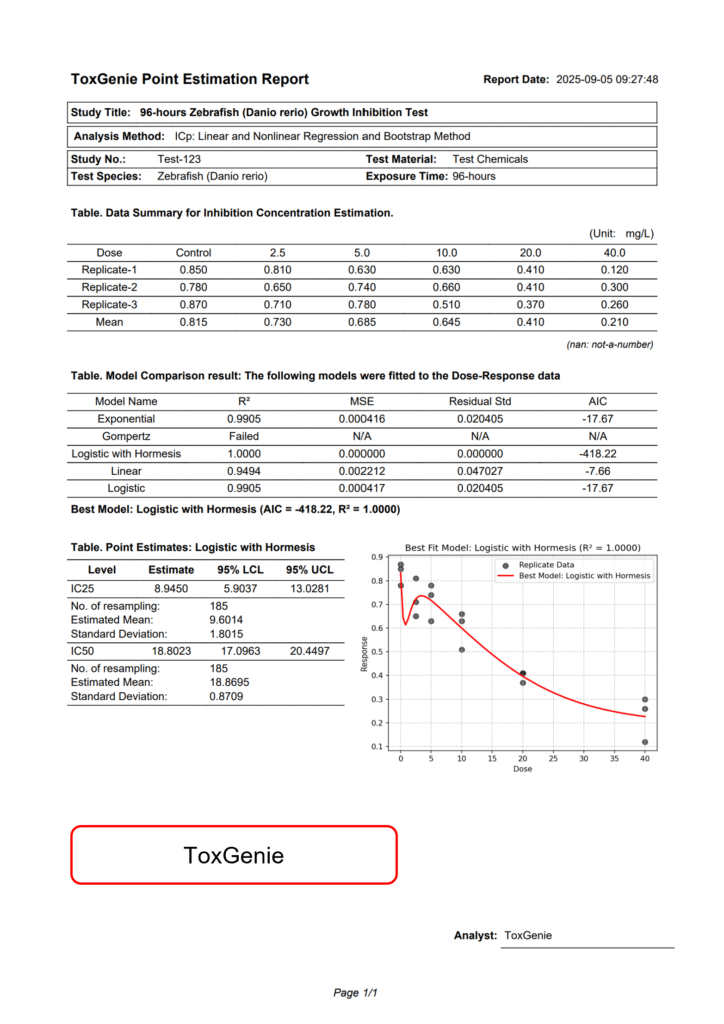
To compare ToxGenie’s analysis results, IC25 and IC50 estimation methods were applied using the same data as in the US EPA Report (EPA/600/4-91/021, February 1992). The results are shown above. However, due to difficulties in obtaining data optimized for each model, representative analysis results are provided, and users are encouraged to analyze various datasets.
The US EPA used the Linear Interpolation method to calculate IC25 and IC50, with 80 resamples. However, Environment Canada (2005) recommends a minimum of 240 resamples. ToxGenie employs 240 resamples, excluding outlier data, to calculate 95% confidence limits. Consequently, there are slight differences from the US EPA results, but all fall within the 95% confidence interval. The reasons for these differences are explained below.
The US EPA’s Linear Interpolation method estimates IC25 and IC50 values through simple linear interpolation, relying on linear connections between data points. This approach is fast and intuitive but may fail to capture nonlinear biological responses (e.g., sigmoidal curves). In contrast, exponential, Gompertz, hormesis, linear, and logistic models use nonlinear regression analysis to model more complex dose-response relationships.
Resampling 80 times estimates 95% confidence limits through bootstrapping but may not fully capture the variability of the distribution due to the small sample size, potentially resulting in less stable confidence limits. Resampling 200 or more times reflects the distribution’s characteristics more accurately, narrowing the confidence interval and increasing stability.
Start Your Toxicity Data Statistical Analysis with ToxGenie
Understanding quantal and quantitative data is the first step toward robust toxicology research. ToxGenie offers an intuitive platform for both data types, suitable for beginners and experts alike. Curious? Start with a 30-day free trial and revolutionize your toxicity data statistical analysis today!