Approximately 30 years ago, when I first began my research, the DOS-based programs distributed by the US EPA were considered state-of-the-art tools. Methods such as the Probit method, Spearman-Karber method, Trimmed Spearman-Karber method, and the Moving Average Angle Method were all included in these distributions. However, as computer operating systems evolved to Windows 11, running DOS programs on modern systems became increasingly cumbersome. Additionally, the limitations of DOS versions—such as difficulties in data input and editing, and the restriction to output-only results—likely contributed to a decline in user adoption. Despite these challenges, I believe the Moving Average-Angle Method offers significant advantages over the Graphical method, particularly for analyzing toxicity test data where only 100% and 0% effect concentrations are present.
Advantages and Disadvantages of the Moving Average Angle Method
The Moving Average Angle Method is a key approach in toxicity data analysis, especially for calculating LC50, EC50, and LD50 values. Below is a summary of its primary advantages and disadvantages.
Advantages:
This method allows for the calculation of LC50, EC50, or LD50 values along with their 95% confidence intervals, even in toxicity tests where no partial mortalities or partial effects occur.
Disadvantages:
The method is applicable only to datasets that include at least two concentrations above the LC50, EC50, or LD50. In other words, there must be two or more concentrations resulting in 100% effect.
The number of test organisms exposed in the toxicity trial influences the variability of the 95% confidence intervals and the G value in the Moving Average Angle Method. If G exceeds 0.2, caution should be exercised when interpreting the LC50, EC50, LD50, and associated confidence intervals. As G approaches 1.0, these estimates and limits become increasingly unreliable and may lose meaningful interpretive value.
Analysis Results of ToxGenie’s Moving Average Angle Methods
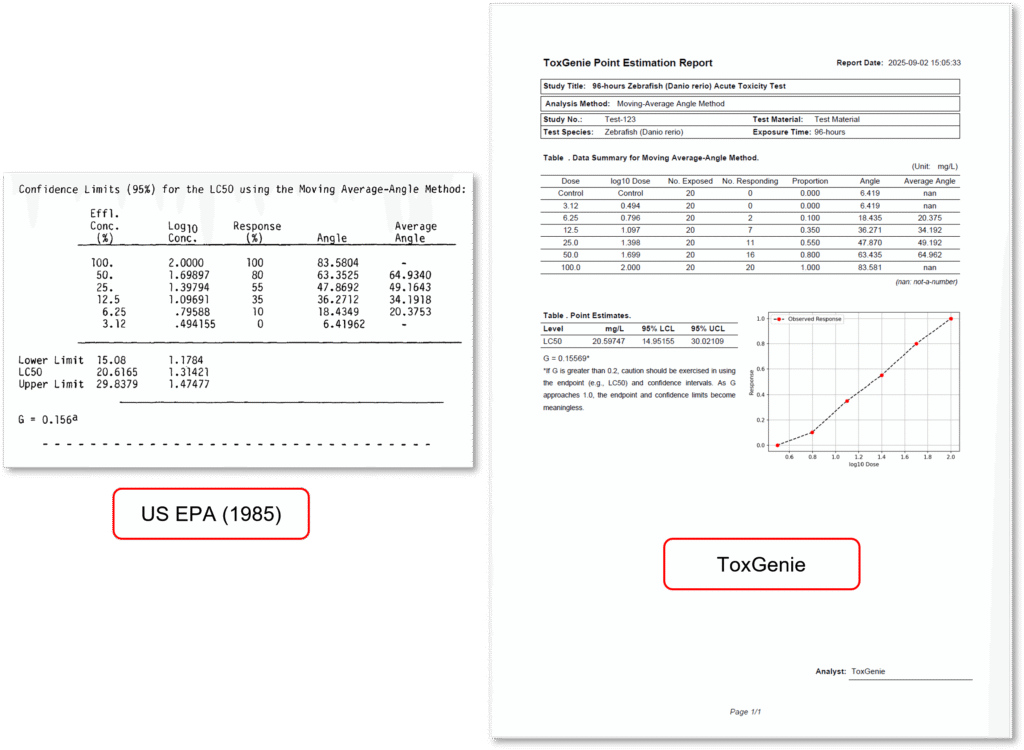
To compare ToxGenie’s analysis results, the Moving Average Angle Methods were applied using the same data as in the US EPA Report (EPA 600/4-85-013, 3rd edition, 1985). The results are shown in the figure above.
Due to differences in the number of decimal places used in mathematical calculations and the criteria for rounding, the results are not entirely identical to those of the US EPA analysis. However, they demonstrate highly accurate calculations. For point estimation analysis, ToxGenie recommends the Probit Method for the US EPA data. However, if the user does not apply the recommended analysis method, ToxGenie can also perform the analysis using a user-specified method.
Start Analyzing with ToxGenie
ToxGenie simplifies complex toxicology data analysis, making it ideal for both beginners and seasoned researchers. Experience it firsthand with a 30-day free trial. Take the first step toward revolutionizing your toxicology research with ToxGenie!